Property score
How it stacks up
Detailed ranking analysis ▼
Street Level (Kingsbury Avenue): Above Average. Ranked #1 out of 32 (Top 3%). The street average for comparable homes is 1,009 sqft.
Neighborhood Level (Garden City): Above Average. Ranked #1 out of 74 (Top 1%). The neighborhood average for comparable homes is 870 sqft.
Citywide Level (Winnipeg): Around Average. Ranked #11,736 out of 26,841 (Top 44%). The citywide average for comparable homes is 1,042 sqft.
Street Level (Kingsbury Avenue): Below Average. Ranked #18 out of 32 (Bottom 44%). The street average for comparable homes is 327.4k.
Neighborhood Level (Garden City): Around Average. Ranked #18 out of 74 (Top 24%). The neighborhood average for comparable homes is 218.9k.
Citywide Level (Winnipeg): Around Average. Ranked #8,594 out of 26,841 (Top 32%). The citywide average for comparable homes is 276.9k.
Street Level (Kingsbury Avenue): Above Average. Ranked #1 out of 32 (Top 3%). The street average for comparable homes is 2017.
Neighborhood Level (Garden City): Above Average. Ranked #1 out of 74 (Top 1%). The neighborhood average for comparable homes is 1984.
Citywide Level (Winnipeg): Above Average. Ranked #2,886 out of 26,841 (Top 11%). The citywide average for comparable homes is 1990.
Garden City market pulse
How to read: Share of sales in each ~$50k price band for “garden city” (Condos, 2024). The tallest band is the mainstream budget range; multi-year view shows how that band shifts over time.
- Exact sold prices
- Detailed market analysis
- PDF report download
- Neighbourhood insights
- Recent sold count in the area
A quick signal for rental-market activity, potential tenant demand, and rental competition around this home.
View Winnipeg rental map →Who lives in this neighbourhood
Transit, amenities & safety
Nearby Amenities
6-651 Kingsbury Avenue — 14 amenities found within 500 m, across 3 categories, including 2 education (nearest 282 m), 5 parks (nearest 164 m).
Crime & safety
We are licensed Manitoba real estate agents. Contact us to obtain all MLS whole sold records for 6-651 Kingsbury Avenue. No advertising. Data source details →
Related homes
Nearby interested homes
Address · Year Built · Living Area
Nearby properties
Address · Distance
Similar assessed value
Address · Tax-Assessed Value
Is this home right for you?
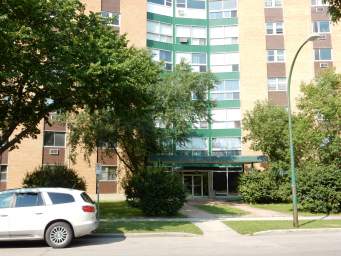
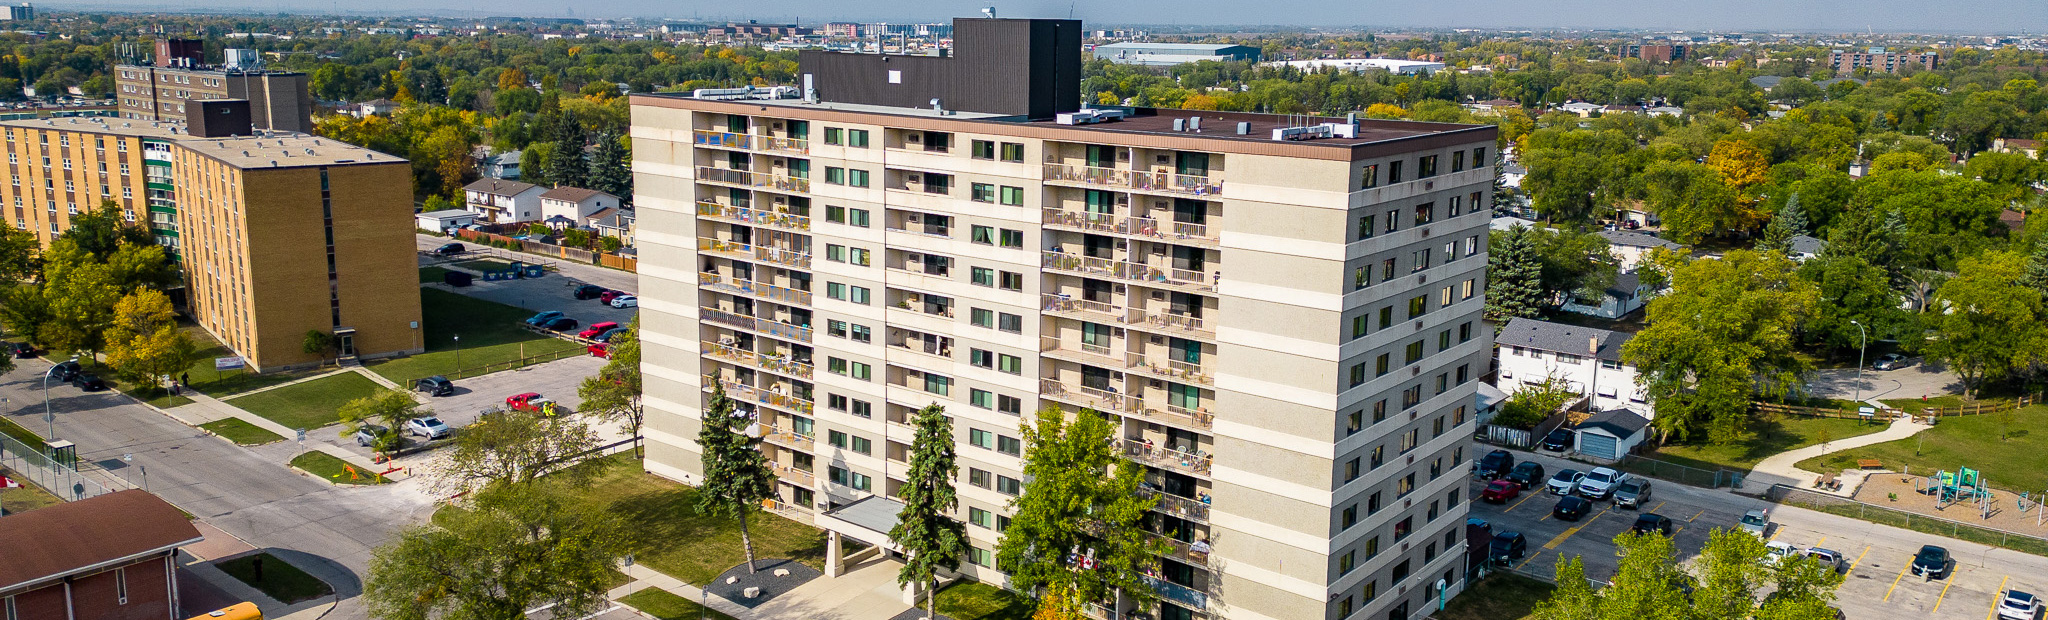
Property Overview: 6-651 Kingsbury Avenue, Garden City, Winnipeg
Section 1: Key Characteristics & Appeal
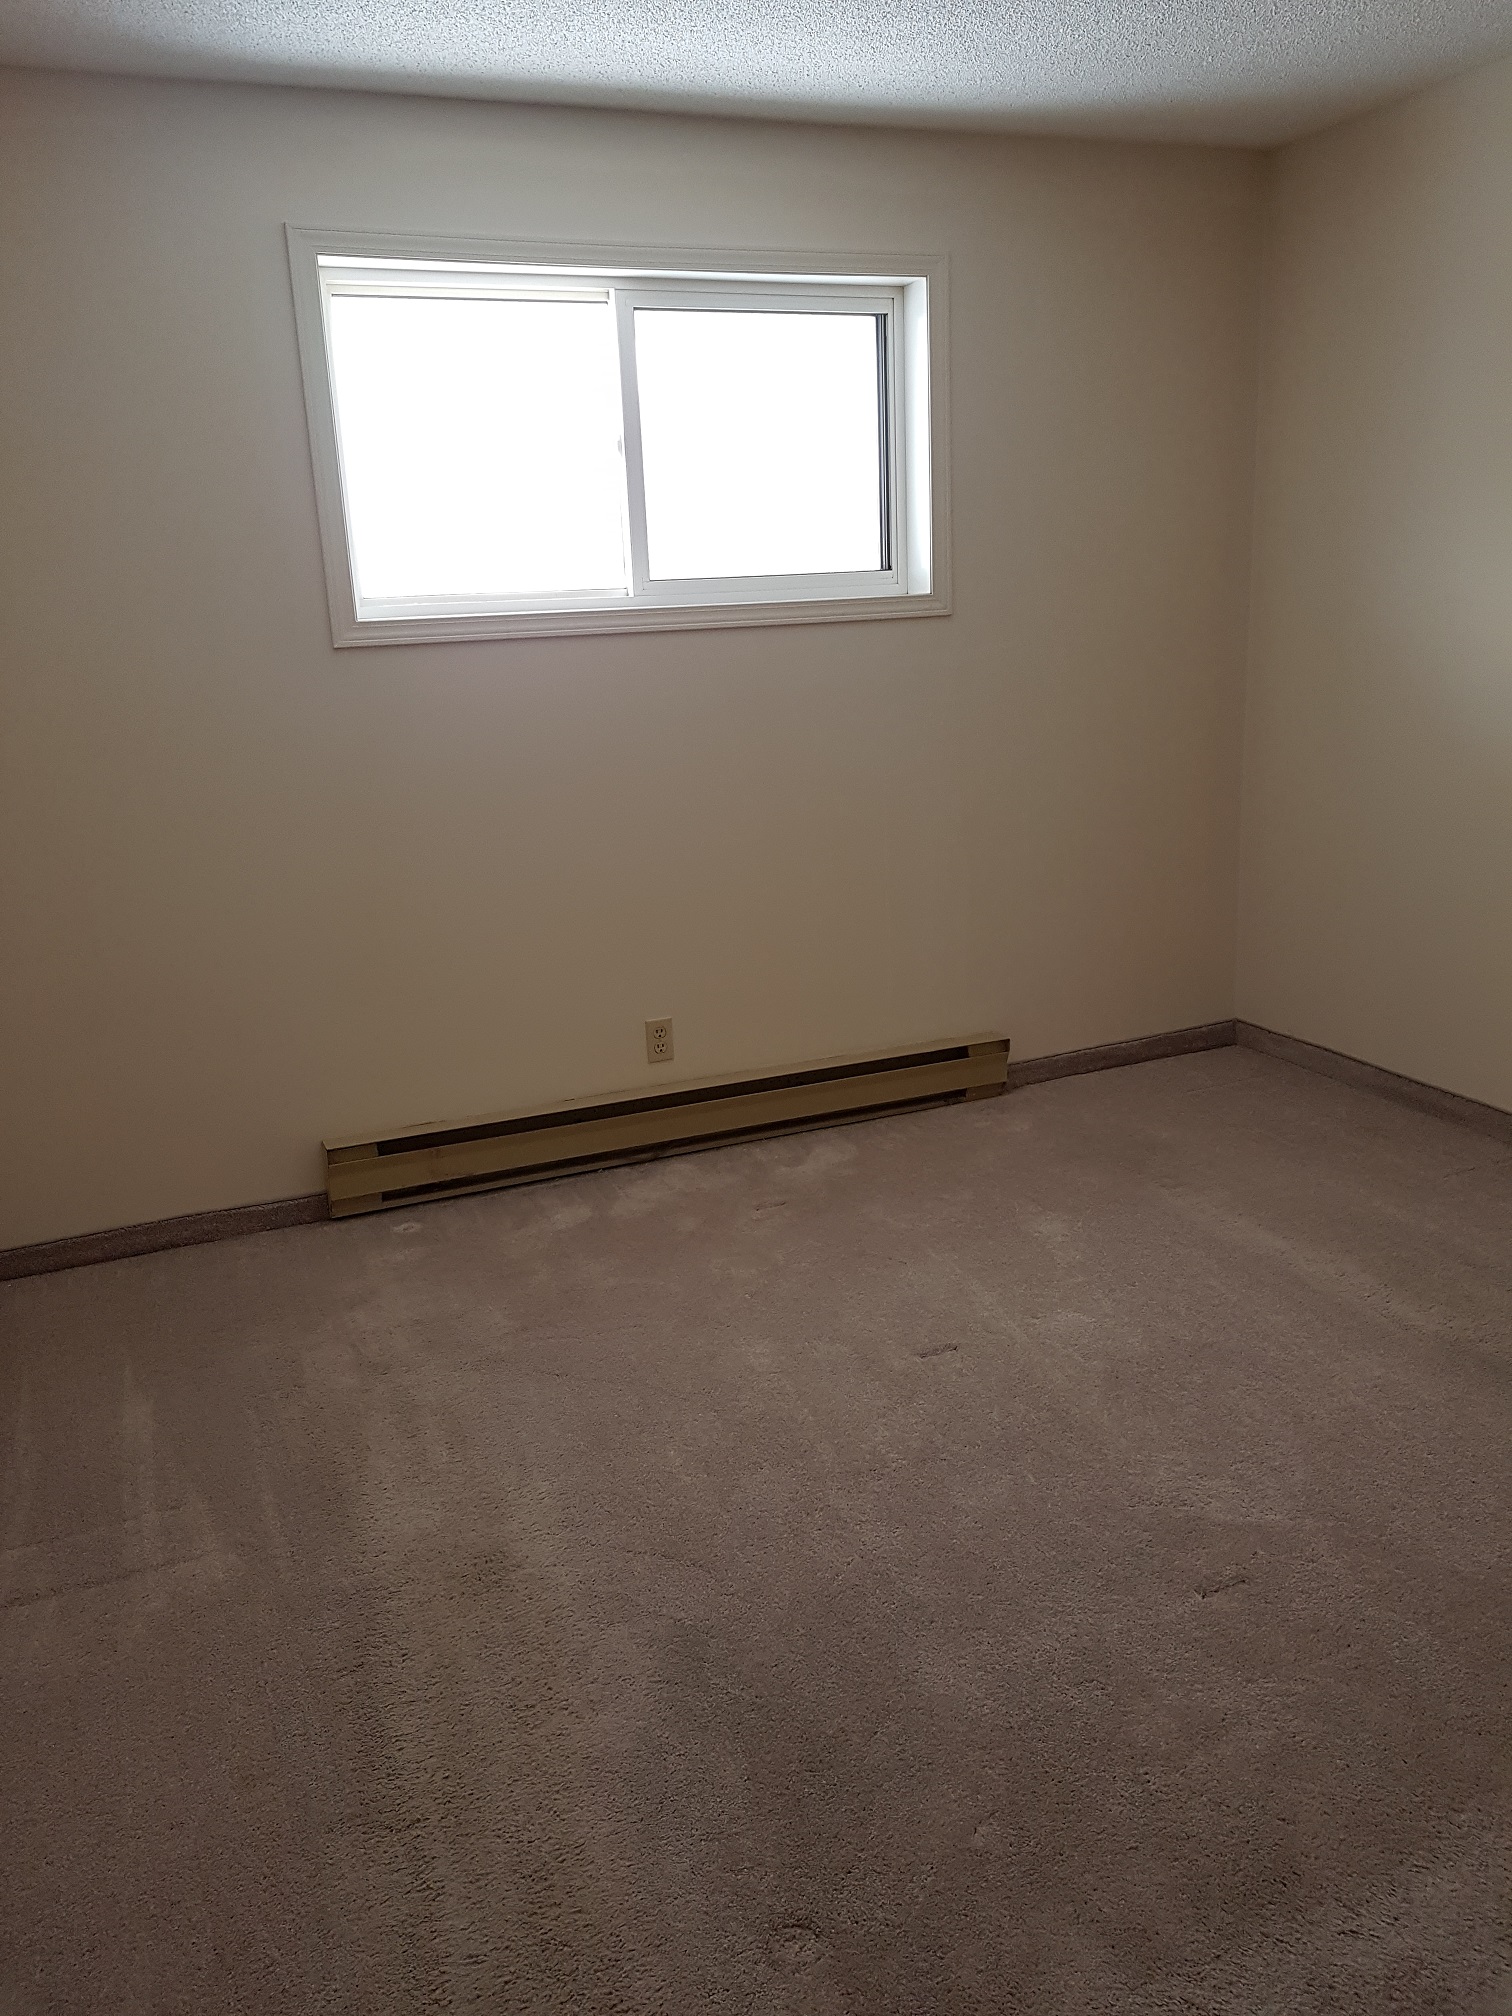
This is a modern, well-sized condominium in Winnipeg's Garden City neighborhood. Built in 2017, it offers 1,045 square feet of living space without a basement. Its primary appeal lies in its contemporary build and efficient use of space, requiring less maintenance than an older home. The data shows it stands out locally: its living area is in the top 1% of comparable Garden City homes, and its 2017 construction date is newer than 99% of area peers. However, its assessed value is above the local average, suggesting it is a premium offering within the neighborhood.
This property would suit a first-time buyer or downsizer seeking a modern, low-maintenance home in a established community. It’s also a practical choice for those who value newer construction (and thus newer building systems) but don’t require a large yard or basement storage. A thoughtful perspective is that while it ranks as "elite" locally for size and age, its city-wide rankings are more moderate, positioning it as a strong value within its specific area rather than the entire city market.
Section 2: Frequently Asked Questions
1. What are the condo fees, and what do they cover?
The listing does not include this information. You will need to request the condo corporation’s financial statements and bylaws to understand the monthly fees and what amenities or services (like building insurance, grounds maintenance, or a reserve fund) they include.
2. Why is the assessed value higher than the last sold price in 2017?
The 2017 sale price was between $235k-$265k, and the current assessed value is $274k. This increase likely reflects general market appreciation over nine years and the fact that the unit was likely purchased new from the builder, with its assessed value now aligning with the broader condominium market.
3. What does "Basement: No" mean?
This indicates the unit is likely a ground-floor or possibly a second-floor condo in a low-rise building, with no underground or lower-level basement space included. All living space is on one level.
4. How does its "above average" assessed value in Garden City affect me?
While it indicates a desirable property, it also means your property taxes will likely be higher than on a comparable-sized but older home in the same area. It’s a trade-off for the newer construction.
5. The sold price history shows a range. How can I find the exact price?
As noted on the detail page, the exact sale price is not public record in Manitoba. You can request it directly from the listing source by email; they provide this data manually as a service.