Property score
How it stacks up
Detailed ranking analysis ▼
Street Level (Sinclair Street): Above Average. Ranked #43 out of 214 (Top 20%). The street average for comparable homes is 1,166 sqft.
Neighborhood Level (Garden City): Around Average. Ranked #564 out of 1,909 (Top 30%). The neighborhood average for comparable homes is 1,307 sqft.
Citywide Level (Winnipeg): Around Average. Ranked #79,288 out of 194,457 (Top 41%). The citywide average for comparable homes is 1,342 sqft.
Street Level (Sinclair Street): Above Average. Ranked #24 out of 214 (Top 11%). The street average for comparable homes is 359.8k.
Neighborhood Level (Garden City): Above Average. Ranked #191 out of 1,909 (Top 10%). The neighborhood average for comparable homes is 402.5k.
Citywide Level (Winnipeg): Around Average. Ranked #69,187 out of 194,455 (Top 36%). The citywide average for comparable homes is 435.4k.
Street Level (Sinclair Street): Around Average. Ranked #83 out of 214 (Top 39%). The street average for comparable homes is 1963.
Neighborhood Level (Garden City): Above Average. Ranked #54 out of 1,909 (Top 3%). The neighborhood average for comparable homes is 1961.
Citywide Level (Winnipeg): Around Average. Ranked #93,401 out of 194,457 (Top 48%). The citywide average for comparable homes is 1966.
Street Level (Sinclair Street): Above Average. Ranked #5 out of 214 (Top 2%). The street average for comparable homes is 4,748 sqft.
Neighborhood Level (Garden City): Above Average. Ranked #83 out of 1,909 (Top 4%). The neighborhood average for comparable homes is 6,278 sqft.
Citywide Level (Winnipeg): Above Average. Ranked #19,281 out of 194,457 (Top 10%). The citywide average for comparable homes is 6,570 sqft.
Garden City market pulse
How to read: Share of sales in each ~$50k price band for “garden city” (Detached houses (non-condo), 2024). The tallest band is the mainstream budget range; multi-year view shows how that band shifts over time.
- Exact sold prices
- Detailed market analysis
- PDF report download
- Neighbourhood insights
- Recent sold count in the area
A quick signal for rental-market activity, potential tenant demand, and rental competition around this home.
View Winnipeg rental map →Who lives in this neighbourhood
Transit, amenities & safety
Nearby Amenities
1058 Sinclair Street — 15 amenities found within 500 m, across 3 categories, including 1 education (nearest 448 m), 5 parks (nearest 243 m).
Crime & safety
Waste collection schedule
We are licensed Manitoba real estate agents. Contact us to obtain all MLS whole sold records for 1058 Sinclair Street. No advertising. Data source details →
Related homes
Nearby interested homes
Address · Year Built · Living Area
Nearby properties
Address · Distance
Similar assessed value
Address · Tax-Assessed Value
Is this home right for you?
Property Overview: 1058 Sinclair Street, Garden City, Winnipeg
Section 1: Key Characteristics & Appeal
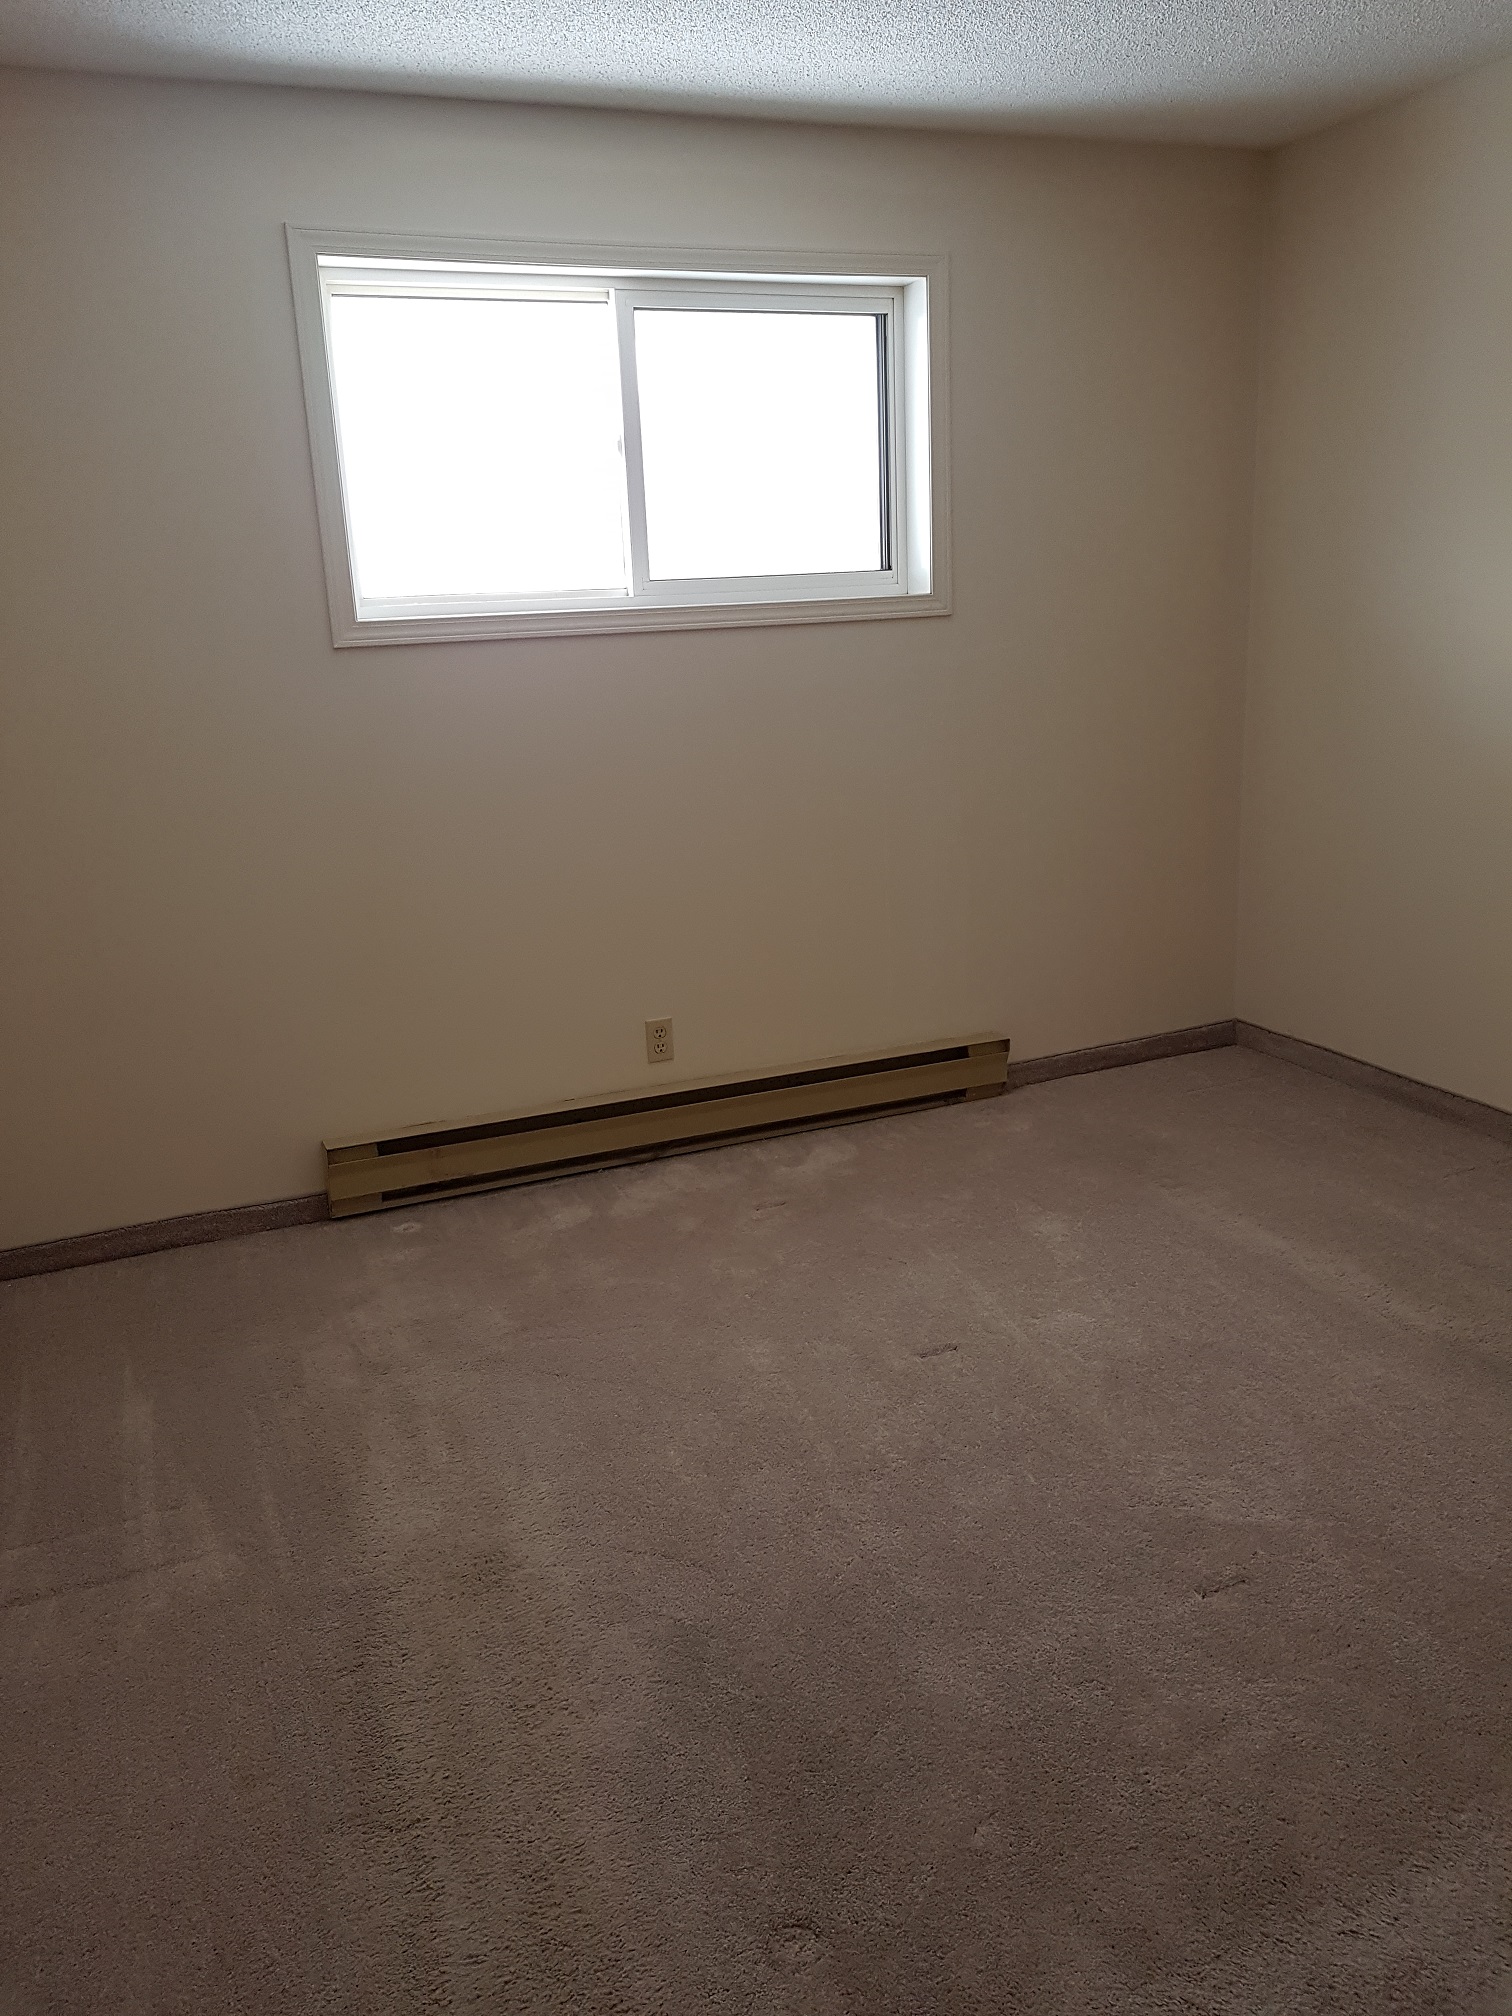
This well-situated one-storey home in Garden City presents a compelling blend of space, value, and potential. Its key characteristic is an exceptionally large lot—over 8,300 sq ft—which ranks in the top 2-4% of the local area. This provides rare outdoor space for gardening, recreation, or future expansion. The living area (1,314 sq ft) is comfortably above average for the immediate neighborhood, and the home benefits from a renovated basement and an attached garage.
The appeal lies in its strong value proposition within a stable community. The assessed value is notably above average for Garden City, suggesting solid fundamentals, yet the historical sold price indicates an accessible entry point relative to the assessed worth. The 1970 build date is newer than most homes in the wider area, a less obvious advantage that can mean updated building standards and potentially fewer major maintenance timelines in the near term.
This property would suit first-time buyers or downsizers seeking a manageable single-level layout with ample yard space. It’s also a fit for value-conscious buyers looking for a home with "good bones" on a premium lot, where the land itself represents a significant long-term asset and the interior offers a renovated starting point.
Section 2: Frequently Asked Questions
1. How does the assessed value compare to the last sold price?
The home’s assessed value is significantly higher than its last recorded sale price (range of $28.5k-$31.5k in 2019). This gap may indicate strong market appreciation, an undervalued previous sale, or municipal assessment trends. It's a key point for discussion with a real estate professional.
2. What does the "renovated basement" include?
The listing notes a renovated basement but does not specify the scope. Buyers should inquire about the quality, permits, and nature of the renovation (e.g., finished living space, updated utilities, moisture management) to understand its true value and condition.
3. Is the large lot a benefit for future expansion?
The elite-sized lot is a major asset. It provides privacy and space not commonly found, but any expansion like an addition or new structure would be subject to local zoning bylaws and setback requirements. Its current value is in the generous outdoor living area it provides.
4. How does this home rank for its age in the area?
While around average for its street, this 1970-built home is newer than 97% of comparable homes in all of Garden City. This can be an advantage, potentially meaning more modern electrical, plumbing, or insulation compared to the neighborhood's predominantly 1960s-built stock.
5. Why is there a range for the last sold price instead of an exact figure?
The exact sale price is not publicly disclosed in Manitoba. The range is estimated from public data. The seller can request the precise figure from the listing provider, which involves a manual process to access non-public records.