Property score
How it stacks up
Detailed ranking analysis ▼
Street Level (Dalhousie Drive): Below Average. Ranked #64 out of 112 (Bottom 43%). The street average for comparable homes is 1,184 sqft.
Neighborhood Level (Fort Richmond): Below Average. Ranked #1,877 out of 2,629 (Bottom 29%). The neighborhood average for comparable homes is 1,421 sqft.
Citywide Level (Winnipeg): Below Average. Ranked #106,002 out of 194,457 (Bottom 45%). The citywide average for comparable homes is 1,342 sqft.
Street Level (Dalhousie Drive): Below Average. Ranked #99 out of 112 (Bottom 12%). The street average for comparable homes is 405.8k.
Neighborhood Level (Fort Richmond): Below Average. Ranked #2,567 out of 2,629 (Bottom 2%). The neighborhood average for comparable homes is 468.9k.
Citywide Level (Winnipeg): Below Average. Ranked #140,987 out of 194,455 (Bottom 27%). The citywide average for comparable homes is 435.4k.
Street Level (Dalhousie Drive): Below Average. Ranked #98 out of 112 (Bottom 12%). The street average for comparable homes is 1974.
Neighborhood Level (Fort Richmond): Below Average. Ranked #1,765 out of 2,629 (Bottom 33%). The neighborhood average for comparable homes is 1972.
Citywide Level (Winnipeg): Around Average. Ranked #97,660 out of 194,457 (Top 50%). The citywide average for comparable homes is 1966.
Street Level (Dalhousie Drive): Below Average. Ranked #72 out of 112 (Bottom 36%). The street average for comparable homes is 5,177 sqft.
Neighborhood Level (Fort Richmond): Below Average. Ranked #2,547 out of 2,629 (Bottom 3%). The neighborhood average for comparable homes is 7,381 sqft.
Citywide Level (Winnipeg): Below Average. Ranked #153,957 out of 194,457 (Bottom 21%). The citywide average for comparable homes is 6,570 sqft.
Fort Richmond market pulse
How to read: Share of sales in each ~$50k price band for “fort richmond” (Detached houses (non-condo), 2024). The tallest band is the mainstream budget range; multi-year view shows how that band shifts over time.
- Exact sold prices
- Detailed market analysis
- PDF report download
- Neighbourhood insights
- Recent sold count in the area
A quick signal for rental-market activity, potential tenant demand, and rental competition around this home.
View Winnipeg rental map →Who lives in this neighbourhood
Transit, amenities & safety
Nearby Amenities
193 Dalhousie Drive — 5 amenities found within 500 m, across 3 categories, including 1 education (nearest 303 m), 2 parks (nearest 173 m).
Crime & safety
Waste collection schedule
We are licensed Manitoba real estate agents. Contact us to obtain all MLS whole sold records for 193 Dalhousie Drive. No advertising. Data source details →
Related homes
Nearby interested homes
Address · Year Built · Living Area
Nearby properties
Address · Distance
Similar assessed value
Address · Tax-Assessed Value
Is this home right for you?
Property Overview: 193 Dalhousie Drive, Fort Richmond, Winnipeg
Section 1: Key Characteristics & Appeal
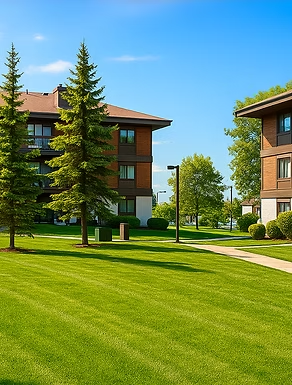
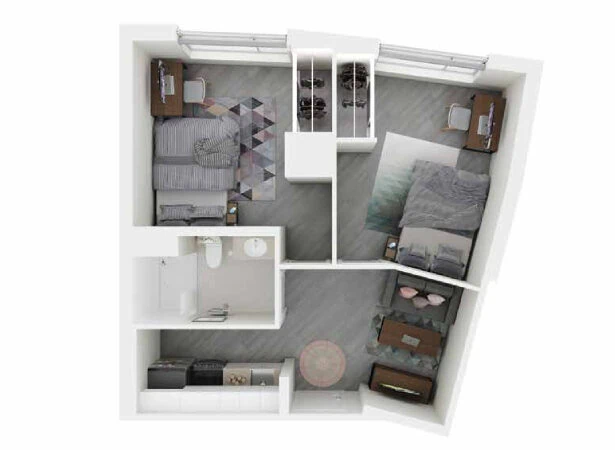
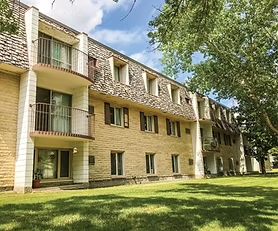
This two-storey home in Fort Richmond presents a practical and value-conscious opportunity. Its key characteristics include 1,155 sqft of living space, a renovated basement, and a 1968 build on a 3,625 sqft lot. The home lacks a garage or pool.
The appeal lies in its relative affordability and established neighbourhood setting. The renovated basement adds functional living space, making the home feel larger than its square footage might suggest. Comparative data shows its assessed value is notably below average for both the immediate street and the wider Fort Richmond area, which could indicate a lower property tax burden or an entry point into a desirable neighbourhood. The lot size, while smaller than many in the area, offers manageable outdoor maintenance.
This property would best suit first-time homebuyers, downsizers, or pragmatic investors seeking a straightforward, no-frills home in a mature community. It’s for those who prioritize location and function over size or modern amenities, and who see potential in a home that may offer value against area benchmarks. A thoughtful perspective is that a smaller, well-placed lot in a mature area like Fort Richmond often translates to less weekend yard work and closer proximity to established community amenities, which can be a significant lifestyle benefit.
Section 2: Frequently Asked Questions
1. Is the assessed value a reliable indicator of the likely selling price?
Not directly. The assessed value (31.30k) is for municipal tax purposes and is consistently shown as below area averages. Market sale prices are influenced by current conditions, the home’s interior condition, and recent upgrades not fully captured in assessment.
2. How does the smaller lot size impact the property?
At 3,625 sqft, the lot is below average for Fort Richmond. This means a smaller yard, which could be a pro for low-maintenance living or a con for those wanting extensive outdoor space. It’s worth checking local bylaws for any expansion limitations.
3. The home was built in 1968. What should I be aware of?
While the basement is noted as renovated, a home of this age may have original components elsewhere, such as plumbing, electrical, windows, or the roof. A thorough inspection is essential to understand the update status of these major systems.
4. There is no garage. What are the parking options?
The listing confirms no garage. Buyers should verify the driveway capacity and on-street parking regulations with the city to ensure it meets their needs, especially during Winnipeg winters.
5. The sold price history shows ranges. How can I get the exact figures?
As noted on the detail page, exact sold prices are provided manually by the listing service upon request via email. The ranges shown (e.g., 30.50k ~ 33.50k in 2021) give a general trend of appreciation over time.