Property Overview
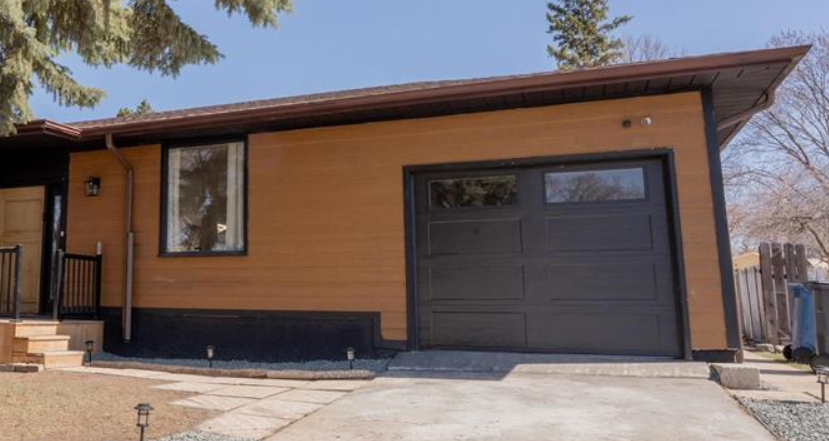
This well-situated one-storey home at 153 Allenby Crescent in Canterbury Park presents a compelling opportunity, particularly for its land value and established location. Built in 1974, the home features 1,120 sqft of living space, a renovated basement, and a detached garage on a generous 5,273 sqft lot. It sold for $350,000 in June 2024.
Its appeal lies in its above-average lot size for both the immediate street and the Canterbury Park neighbourhood, offering room for gardening, play, or expansion. The renovated basement adds functional living space. The home suits first-time buyers seeking a solid starter home with a good yard, or practical investors looking for a property with strong land value in a mature area. It’s a home for those who prioritize space and location over a newer build or extensive modern finishes.
Frequently Asked Questions
1. How does the lot size compare to others?
The 5,273 sqft lot is notably larger than many in the area. It ranks in the top 16% on its own street and the top 26% within the Canterbury Park neighbourhood, meaning you get more outdoor space than most comparable properties nearby.
2. Is the home older than others in the area?
Yes. Built in 1974, it is older than the average home in Canterbury Park, ranking in the top 97% for age (meaning 97% of area homes are newer). However, it is actually newer than the average home city-wide. This suggests the immediate neighbourhood has seen more recent development.
3. What does the "Elite" ranking for Assessed Value on the street mean?
This indicates the home’s municipal assessed value ($37,200) is among the highest few on Allenby Crescent (top 4%). This doesn't directly dictate market price, but it often reflects a favourable municipal valuation relative to immediate neighbours, potentially due to lot size, improvements, or condition.
4. Is the living space larger than average?
At 1,120 sqft, it is above average for its specific street but is around the average size for both the wider Canterbury Park neighbourhood and the city of Winnipeg as a whole. The layout and the renovated basement are key to the home’s total usable space.
5. How does the recent sale price fit the market?
The $350,000 sale price placed the home in the top 20% for sale prices on its street, suggesting it was a premium property for Allenby Crescent. Compared to the wider neighbourhood and city, the price was around the average, indicating good value for the lot size and location within the broader market.