The real estate market is turning around
Winnipeg Weekly Real Estate Market Report
May 18 – May 24, 2026
This report is manually compiled from detached house and condominium transaction data in the Winnipeg area for the week of May 18–24, 2026. It aims to reflect actual market activity, with a focus on price performance, demand intensity, and transaction patterns. While every effort has been made to ensure accuracy, this report is for market reference only and does not constitute real estate or investment advice.
🌡️ Market Temperature Snapshot
| Metric | This Week | Reading |
|---|---|---|
| Tracked sales | 75 | — |
| Sold above asking | ~52% | ⚖️ Approaching balance |
| Median days on market | 9 days | Still fairly quick |
| Average premium | +4.8% | Notable drop vs last week |
| Median premium | ~0% | Market turning point signal |
| Median price per sqft | ~$344/sqft | — |
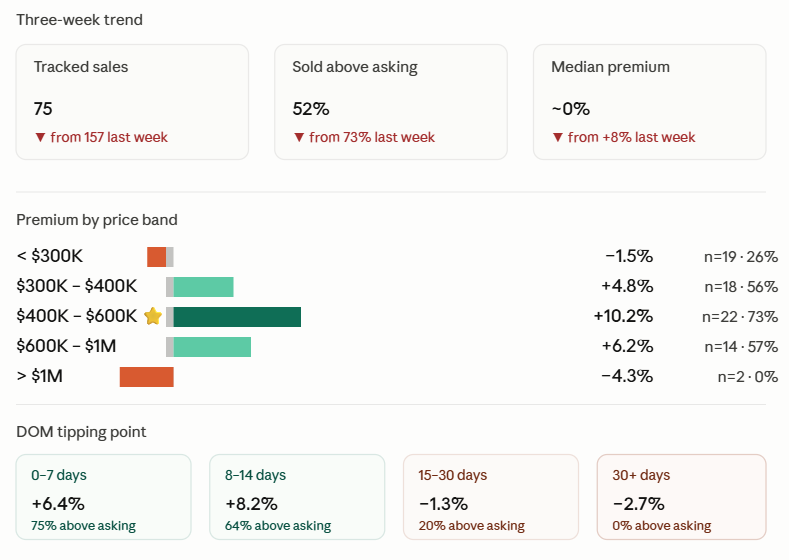
Overall read: Winnipeg's market showed a clear cooling this week — last week was still firmly seller-led (73% over asking, +8% premium), but this week the market has approached buyer-seller balance: only 52% closed above asking, and the median premium fell to essentially zero. Segmentation has intensified further: the $400K–$600K mid-range detached segment remains hot, while post-2010 new builds, condos, and listings sitting beyond 15 days have all cooled across the board.
1. Overall Market Overview
- Total sales: 75 (nearly halved from last week's 157)
- Property mix: Detached 92% (69 units) | Condo 8% (6 units)
- Average sold price: ~$453K
- Median sold price: ~$408K
- Build year range: 1905 to 2027 (one pre-construction unit)
- Above asking: ~52% | At asking: ~5% | Below asking: ~43%
Comparison with prior two weeks: Above-asking share fell from ~65–73% to 52%; below-asking share rose from ~17% to 43%. This is the most significant tonal shift in the market over the past three weeks.
2. Days on Market (DOM) Tipping Point ⚠️
The DOM tipping-point effect remains clear, though this week's "safe zone" has shifted slightly earlier.
| Days on Market | Listings | Avg Premium | % Sold Above Asking |
|---|---|---|---|
| 0–7 days | 20 | ~+6.4% | ~75% |
| 8–14 days | 33 | ~+8.2% | ~64% |
| 15–30 days | 15 | ~−1.3% | ~20% |
| 30+ days | 7 | ~−2.7% | 0% |
Key insight: Within 14 days remains the safe zone for seller leverage — 75% (0–7 days) to 64% (8–14 days) of listings sell above asking, averaging 6–8% premiums. Beyond 14 days, the turn is fast: the 15–30 day band has already slipped into negative territory, with only 20% selling above asking. Beyond 30 days, not a single listing sold above asking.
For sellers: The 14-day tipping point has now been validated for three consecutive weeks. Have a backup plan ready by day 10; once past 14 days, consider proactive repricing or restaging. Past 30 days, expect concessions in the 3–10% range.
3. Sold Price vs Listing Price
The share of below-asking sales rose notably this week, expanding buyer negotiating room.
- ~52% sold above asking (last week ~73%)
- ~5% sold at asking
- ~43% sold below asking (last week ~17%)
Top 5 by Premium %
| Address | Premium % | Premium $ |
|---|---|---|
| 63 Berrydale Avenue | +27.4% | +$82,100 |
| 143 Stradford Street | +26.4% | +$95,100 |
| 149 La Verendrye Street | +25.5% | +$102,100 |
| 622 Warsaw Avenue | +25.0% | +$106,100 |
| 9 Radburn Place | +22.7% | +$120,100 |
Top 5 by Premium $ Amount
| Address | Premium $ | Premium % |
|---|---|---|
| 9 Radburn Place | +$120,100 | +22.7% |
| 622 Warsaw Avenue | +$106,100 | +25.0% |
| 149 La Verendrye Street | +$102,100 | +25.5% |
| 209 Athlone Drive | +$100,100 | +17.6% |
| 1730 Chancellor Drive | +$98,000 | +22.5% |
The top of the premium leaderboard is entirely $300K–$600K post-war detached homes (1940s–1970s), consistent with the findings in Sections 4 and 5.
Biggest Discounts 🔻
| Address | Discount % | Discount $ | DOM |
|---|---|---|---|
| 17 Elm Park Road | −11.6% | −$34,900 | 18 days |
| 557 Doucet Street | −8.9% | −$17,400 | 23 days |
| 991 Lorette Avenue | −8.9% | −$19,900 | 12 days |
| #214 77 Edmonton Street (condo) | −8.3% | −$9,900 | 10 days |
| 127 Egesz Street | −7.8% | −$24,900 | 23 days |
| 112 Creekside Road | −7.3% | −$129,000 | 17 days |
| 215 Carriage Road | −7.6% | −$29,900 | 35 days |
Pattern: The deepest percentage discounts remain concentrated in low-end older homes and long-sitting listings. The largest dollar concession this week (112 Creekside Road, −$129K) came from the $1.78M luxury segment — a single large markdown materially impacts that segment's averages.
4. Price Band Heat Map
The hot-cold divergence across price bands reached its sharpest level of the year so far this week.
| Price Band | Sales | Share | % Above Asking | Avg Premium | Avg DOM |
|---|---|---|---|---|---|
| < $300K | 19 | ~25% | ~26% | ~−1.5% | ~16 days |
| $300K – $400K | 18 | ~24% | ~56% | ~+4.8% | ~13 days |
| $400K – $600K ⭐ | 22 | ~29% | ~73% | ~+10.2% | ~9 days |
| $600K – $1M | 14 | ~19% | ~57% | ~+6.2% | ~15 days |
| > $1M | 2 | ~3% | 0% | ~−4.3% | ~33 days |
This week's seller sweet spot: $400K – $600K. This is the only band maintaining last week's overall market tone — 73% above asking, +10.2% average premium, just 9 days DOM. The $600K–$1M band cooled noticeably (from +10.2% last week to +6.2%, with DOM extending from 9 to 15 days), suggesting weakness at the upper end has begun bleeding into what was previously the strongest segment.
The sub-$300K band continues to struggle (−1.5%, 16 days DOM), and the $1M+ luxury band saw only 2 sales this week, both below asking.
5. Performance by Build Era
The most notable structural signal this week: a flip between new builds and older homes.
| Build Era | Sales | Avg Premium | Median $/sqft | % Above Asking |
|---|---|---|---|---|
| Pre-1950 | 22 | ~+4.7% | ~$277 | ~50% |
| 1950 – 1980 ⭐ | 25 | ~+7.5% | ~$372 | ~60% |
| 1980 – 2010 | 14 | ~+4.7% | ~$346 | ~71% |
| 2010 to present ⚠️ | 14 | ~+0.2% | ~$360 | ~21% |
Post-war homes (1950s–70s) remain the hottest segment for three consecutive weeks, with an average premium of +7.5% this week.
⚠️ Post-2010 new builds essentially saw "zero premium" this week: of 14 sales, only 3 closed above asking (21%), with an average premium of just +0.18%. Several 2024–2025 new builds (840 Carter Avenue, 123 Yellow Moon Crescent, 3 Broda Drive) sold below asking, with DOM ranging from 17 to 56 days. This signal is sharper than last week — negotiating room on new builds continues to open up.
Possible explanations: (a) new builds are priced close to replacement cost, leaving little upward elasticity; (b) post-war homes offer reasonable square footage, established locations, and a lower entry price; (c) some pre-construction/spec-build buyers may be facing closing pressure.
6. Price Per Square Foot ($/sqft) Reference
For quick valuation comparisons:
| Category | Median $/sqft |
|---|---|
| All listings | ~$344 |
| Pre-1950 older homes | ~$277 |
| 1950–1980 listings | ~$372 |
| 1980–2010 listings | ~$346 |
| Post-2010 new builds | ~$360 |
| 25th percentile (all) | ~$298 |
| 75th percentile (all) | ~$402 |
This week's overall median $/sqft (~$344) is down about 11% from last week's ~$388. Some of this reflects a sales mix tilted toward lower price bands, but it also reflects broader pricing pressure.
7. Detached vs Condominium
Condo weakness persists and is deepening.
| Property Type | Sales | Avg Sold Price | Avg Premium | Avg DOM | % Above Asking |
|---|---|---|---|---|---|
| Detached | 69 | ~$467K | ~+5.3% | ~13 days | ~55% |
| Condominium | 6 | ~$293K | ~−1.3% | ~16 days | ~17% |
Of the 6 condo sales this week, only one (#4 2075 Henderson Highway, +7.2%) closed above asking; four sold below asking, and one at asking. Condo sellers should continue with defensive pricing — multiple-offer bidding is not a reasonable baseline expectation. Weakness among new/pre-construction condos (#451 1505 Molson Street, #500 635 Ballantrae Drive) is particularly worth noting.
8. Key Takeaways (Actionable)
- ⚖️ Market tone has shifted: For the first time in three weeks, the median premium dropped to 0% and the below-asking share climbed to 43%. The seller's market is giving back some leverage.
- 🎯 $400K–$600K is currently the only "complete hot zone" — 73% bidding, +10% premium, 9-day DOM. All other price bands cooled to varying degrees.
- ⏱️ The 14-day tipping point holds for a third consecutive week. Beyond 14 days, leverage shifts quickly to buyers; beyond 30 days, it shifts completely.
- 🏠 Post-war homes (1950s–70s) remain the strongest segment — top-ranked premium for three weeks running, averaging +7.5%.
- 🏗️ New builds (2010+) showed essentially zero premium. Only 21% sold above asking. New-build sellers should set aside premium expectations.
- 🏢 Condos continue to weaken — only 17% above asking, averaging below list price.
- 💰 $1M+ luxury: Only 2 sales this week, both below asking, including a $129K concession at 112 Creekside Road. This segment needs realistic pricing.
Summary
Winnipeg's market this week showed its most pronounced cooling in three weeks — sales volume nearly halved (75 vs 157), the median premium fell to zero, and the below-asking share nearly tripled.
The market is no longer uniformly hot — segmentation is now clear: the $400K–$600K post-war detached segment is the only remaining stronghold; new builds, condos, luxury homes, sub-$300K listings, and any listing over 15 days have all entered buyer negotiating territory.
The 14-day tipping point rule remains in force, and matters even more this week — beyond 14 days, leverage flips completely.
Methodology Note
- Sample size: 75 transactions (69 detached, 6 condos)
- Date range: May 18 – May 24, 2026
- Source: Manually compiled MLS transaction data
- Data completeness: No missing fields in this dataset
- Rounding: Most figures rounded for readability; treat as approximate
- Sample size caveat: Lower transaction volume this week (75 vs last week's 157) means some sub-segments (e.g. >$1M, condos) have small samples — trend reads should be confirmed against subsequent weeks
Report prepared May 24, 2026. Not real estate or investment advice.