Winnipeg Real Estate Market Summary – Week 19, May 10, 2026
This summary is based on residential and condominium sales in Winnipeg during the week of May 4 – May 10, 2026. The data has been manually compiled to reflect actual market activity, focusing on pricing behaviour, demand levels, and transaction patterns. While every effort has been made to ensure accuracy, this should be considered a general market reference rather than real estate advice.
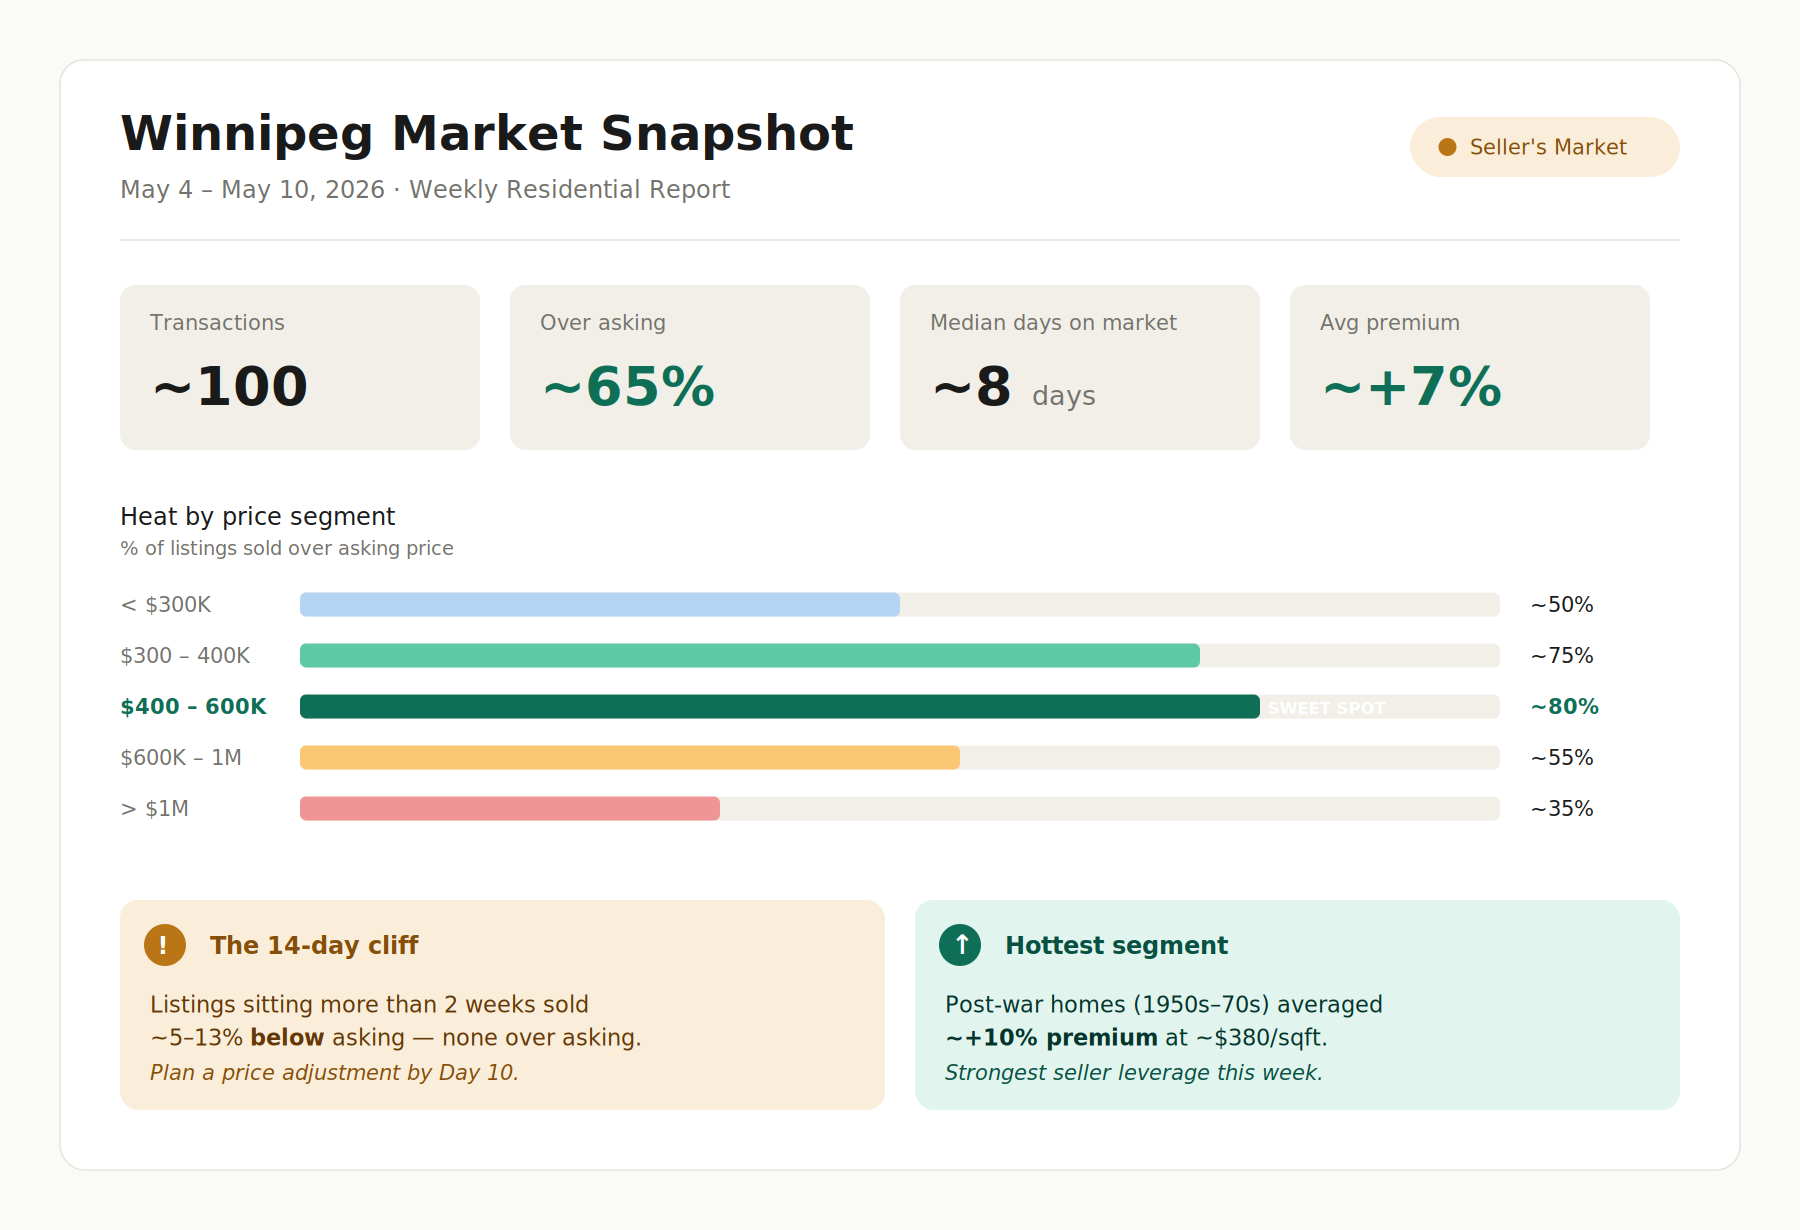
🌡️ Market Temperature Snapshot
| Indicator | This Week | Reading |
|---|---|---|
| Properties Tracked | ~100 | — |
| Sold Over Asking | ~65% | 🔥 Seller's market |
| Median Days on Market | ~8 days | Fast turnover |
| Average Premium | ~+7% | Sustained pressure |
| Median $/sqft | ~$370 | — |
Verdict: Winnipeg remains a firm seller's market, but with clear segmentation — the heat is heavily concentrated in mid-range detached homes, while condos and luxury homes show notable cooling.
1. Overall Market Summary
- Total Transactions: ~100 properties
- Property Mix: Houses ~95% | Condos ~5%
- Average Sale Price: ~$480K
- Median Sale Price: ~$445K
- Year Built Range: Early 1900s to 2026 construction
- Above Asking: ~65% | At Asking: ~10% | Below Asking: ~25%
Detached homes continue to dominate market activity. Condos remain a minor share of weekly transactions and, more importantly, are no longer competing on price — see Section 7.
2. The DOM Tipping Point ⚠️
The most actionable pattern of the week: there is a clear two-week cliff in negotiating power.
| Days on Market | # Properties | Avg Premium | % Sold Over Asking |
|---|---|---|---|
| 0–7 days | ~50 | ~+8% | ~70% |
| 8–14 days | ~40 | ~+11% | ~80% |
| 15–30 days | ~10 | ~−5% | 0% |
| 30+ days | ~5 | ~−13% | 0% |
Key insight: If a property doesn't sell within 14 days, the negotiation power flips entirely to the buyer. Listings sitting beyond two weeks closed at meaningful discounts this week — none above asking.
Implication for sellers: Have a Plan B ready by Day 10 (price adjustment, staging refresh, marketing push). After Day 14, expect to give back 5–10% or more.
3. Sold Price vs List Price
The market favoured sellers again this week, but with a wider tail of underperformers than headlines suggest.
- ~65% of properties sold above asking
- ~10% sold at asking
- ~25% sold below asking
Highest Premium (Percentage)
| Address | Premium |
|---|---|
| 26 Clonard Avenue | ~+40% |
| 27 Thorndale Avenue | ~+34% |
| 95 Riel Avenue | ~+33% |
| 614 Oxford Street | ~+28% |
| 65 Chandos Avenue | ~+28% |
Highest Premium (Amount)
| Address | Price Difference |
|---|---|
| 58 Bramble Drive | ~+$145K |
| 1216 Mulvey Avenue | ~+$135K |
| 614 Oxford Street | ~+$125K |
| 65 Chandos Avenue | ~+$115K |
| 95 Riel Avenue | ~+$115K |
Largest Discounts 🔻
| Address | Discount | DOM |
|---|---|---|
| 793 Pacific Avenue | ~−33% | ~50 days |
| 131 Traill Avenue | ~−21% (~−$80K) | ~15 days |
| 1507 Magnus Avenue | ~−20% (~−$50K) | ~7 days |
| 426 St Anthony Avenue | ~−14% | ~6 days |
| 142 OAK Street | ~85 days |
Pattern: The deepest discounts cluster at the price extremes — older properties below $250K and listings above $850K. The mid-range remained competitive even on the down side.
4. Price Segment Heat Map
Beyond volume, this table shows where competition is most intense.
| Price Range | Share of Sales | % Over Asking | Avg Premium | Avg DOM |
|---|---|---|---|---|
| < $300K | ~25% | ~50% | ~+4% | ~14 days |
| $300K – $400K | ~35% | ~75% | ~+10% | ~7 days |
| $400K – $600K ⭐ | ~25% | ~80% | ~+9% | ~9 days |
| $600K – $1M | ~15% | ~55% | ~+3% | ~24 days |
| > $1M | ~3% | ~35% | ~−1% | ~12 days |
Seller's sweet spot: $300K – $600K. Nearly 80% of listings in the $400–600K band sold above asking, with the strongest combination of premium and speed. Above $600K, demand thins out quickly and DOM more than doubles.
5. Era / Build Year Performance
A counter-intuitive finding worth flagging:
| Era | # Sold | Avg Premium | Median $/sqft |
|---|---|---|---|
| Pre-1950 | ~30 | ~+6% | ~$320 |
| 1950 – 1980 ⭐ | ~40 | ~+10% | ~$380 |
| 1980 – 2010 | ~20 | ~+5% | ~$395 |
| 2010 onward | ~15 | ~+2% | ~$440 |
Post-war homes (1950s–1970s) are the most competitively bid asset in Winnipeg right now. Newer construction commands a higher $/sqft but rarely sees bidding wars — most newer homes (2010+) sold at or just above asking.
This likely reflects a combination of (a) attractive entry prices, (b) established neighbourhoods, and (c) buyer willingness to renovate.
6. $/sqft Reference Table
For quick valuation benchmarking:
| Segment | Median $/sqft |
|---|---|
| All Properties | ~$370 |
| Pre-1950 stock | ~$320 |
| 1950–1980 stock | ~$380 |
| Newer construction (post-2010) | ~$440 |
| 25th percentile | ~$320 |
| 75th percentile | ~$430 |
Listings substantially below segment median may be candidates for bidding wars; those well above warrant scrutiny of unique features or potential overpricing.
7. House vs Condo Spotlight
A divergence worth flagging — condos materially underperformed houses this week.
| Type | # Sold | Avg Price | Avg Premium | Avg DOM |
|---|---|---|---|---|
| Detached House | ~100 | ~$485K | ~+7% | ~12 days |
| Condo | ~5 | ~$330K | ~−1% | ~13 days |
The condo sample is small, but the direction is clear: condos averaged below asking this week, while houses averaged 7% above. Condo sellers should price defensively and not expect multiple offers.
8. Key Takeaways (Actionable)
- 🎯 If listing in $400–600K, expect bidding wars. Pricing slightly under market continues to trigger 8–10% premiums.
- ⏱️ The 14-day rule: If your home doesn't sell in two weeks, plan for a 5–10% concession.
- 🏠 Post-war homes (1950s–70s) are this market's hottest segment — sellers in this category have the strongest leverage.
- 🏢 Condo sellers: price defensively. The condo market is no longer keeping pace with detached homes.
- 💰 Luxury (>$1M) and entry-level (<$250K) require realistic pricing. Both segments show the deepest discounts and longest DOM.
Summary
Well-priced mid-range homes continue to sell quickly, often with multiple offers.
Buyers remain highly active in the $300–600K detached market, while condos, luxury homes, and aged listings face increasing resistance.
The 14-day mark remains the line between seller leverage and buyer leverage.
Report prepared May 10, 2026. Not real estate or investment advice.