Winnipeg Real Estate Market Summary – Week 15, April 12, 2026
This analysis is based on manually compiled transaction data for residential homes and condominiums in Winnipeg from 2026-04-06 to 2026-04-12. It aims to reflect the real market as accurately as possible and to reveal current trends in price distribution, premium patterns, and transaction characteristics. However, absolute accuracy cannot be guaranteed, and this does not constitute any advice for buying or selling real estate.
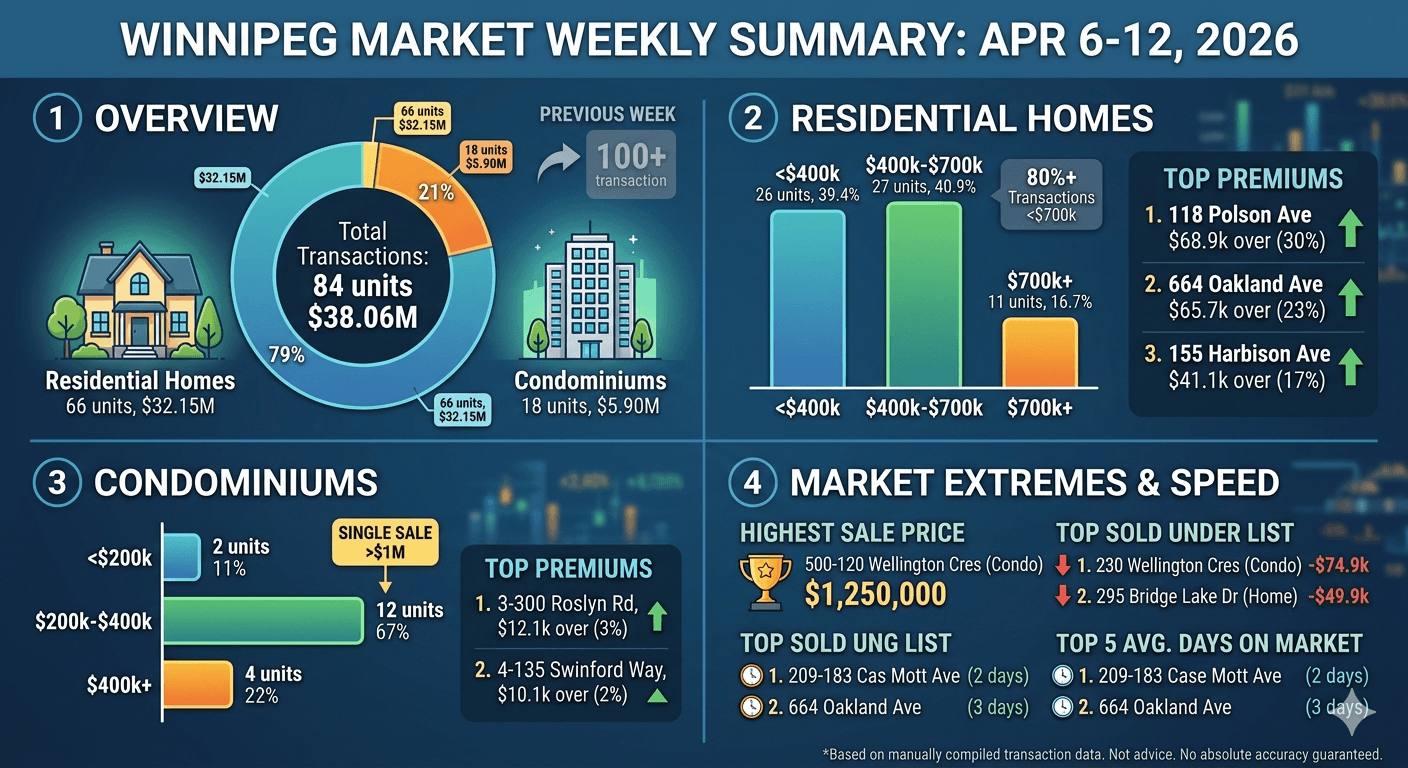
1. Market Overview
- Total transactions: Approximately 70
- Average sale price: Around 500K
- Property type breakdown:
- House: 90%+
- Condo: Around 10%
The market is clearly dominated by detached homes, with a relatively small share of condominium sales.
2. Days on Market (DOM)
- Most properties sold within 5–10 days
- A smaller portion took over 20 days (typically overpriced or less competitive listings)
Overall, the pace is relatively fast, indicating strong market activity.
3. Premium vs Discount Trends
Overall Characteristics
- Approximately 65%–70% of properties sold above asking
- The market remains seller-favored
Areas with Higher Premium Amounts
| Area | Premium Range |
|---|---|
| Buchanan | Around +140K |
| Wellington Crescent | Around +100K |
| Bridgwater Lakes | Around +70K |
Areas with Higher Premium Percentages
| Area | Premium % |
|---|---|
| Buchanan | Around +25% |
| St. Johns | Around +30% |
| Southdale | Around +15% |
Discount Sales Characteristics
- More common in:
- Areas with higher new inventory
- Overpriced listings
- Discounts are generally limited, typically around 10K – 30K
4. Price Distribution
| Price Range | Characteristics |
|---|---|
| < 300K | Older homes, smaller size, more common in north-end areas |
| 300K – 500K | Core segment with the highest share |
| 500K – 700K | Move-up buyers, mainly in south-end areas |
| > 700K | Higher-end properties in premium locations |
The market is clearly centered around the 300K to 500K range.
5. Age Distribution
| Year Range | Characteristics |
|---|---|
| After 2000 | Newer homes, mostly in the south |
| 1980 – 2000 | Core supply, widely distributed |
| 1950 – 1980 | Mature neighborhoods |
| Before 1950 | More common in central older areas |
Mid-aged and older homes continue to dominate the market.
6. Size Distribution
- Main segment: 1000 – 2000 sqft
- Under 1000 sqft: typically entry-level or investment properties
- Over 2000 sqft: move-up and higher-end homes
7. Key Takeaways
The current market shows several clear patterns:
- Fast transaction pace with quick absorption of well-priced homes
- Widespread premium pricing, indicating ongoing competition
- The 300K–500K range remains the core of the market
- Clear geographic variation, with stronger premiums in mature areas
Overall, the market remains in a moderately seller-favored condition.
Due to certain limitations, precise figures cannot be guaranteed. For more timely and detailed data, please contact us directly.