Property score
How it stacks up
Detailed ranking analysis ▼
Street Level (Ulster Street): Above Average. Ranked #1 out of 5 (Top 20%). The street average for comparable homes is 1,120 sqft.
Neighborhood Level (Fort Richmond): Above Average. Ranked #4 out of 653 (Top 1%). The neighborhood average for comparable homes is 894 sqft.
Citywide Level (Winnipeg): Around Average. Ranked #7,231 out of 26,841 (Top 27%). The citywide average for comparable homes is 1,042 sqft.
Street Level (Ulster Street): Above Average. Ranked #1 out of 5 (Top 20%). The street average for comparable homes is 304.8k.
Neighborhood Level (Fort Richmond): Above Average. Ranked #4 out of 653 (Top 1%). The neighborhood average for comparable homes is 185.3k.
Citywide Level (Winnipeg): Around Average. Ranked #7,819 out of 26,841 (Top 29%). The citywide average for comparable homes is 276.9k.
Street Level (Ulster Street): Above Average. Ranked #1 out of 5 (Top 20%). The street average for comparable homes is 1977.
Neighborhood Level (Fort Richmond): Around Average. Ranked #184 out of 653 (Top 28%). The neighborhood average for comparable homes is 1980.
Citywide Level (Winnipeg): Below Average. Ranked #18,777 out of 26,841 (Bottom 30%). The citywide average for comparable homes is 1990.
Fort Richmond market pulse
How to read: Share of sales in each ~$50k price band for “fort richmond” (Condos, 2024). The tallest band is the mainstream budget range; multi-year view shows how that band shifts over time.
- Exact sold prices
- Detailed market analysis
- PDF report download
- Neighbourhood insights
- Recent sold count in the area
A quick signal for rental-market activity, potential tenant demand, and rental competition around this home.
View Winnipeg rental map →Who lives in this neighbourhood
Transit, amenities & safety
Nearby Amenities
99 Ulster Street — 28 amenities found within 500 m, across 6 categories, including 13 dining (nearest 292 m), 4 education (nearest 282 m), 4 healthcare (nearest 173 m).
Crime & safety
We are licensed Manitoba real estate agents. Contact us to obtain all MLS whole sold records for 99 Ulster Street. No advertising. Data source details →
Related homes
Nearby interested homes
Address · Year Built · Living Area
Nearby properties
Address · Distance
Similar assessed value
Address · Tax-Assessed Value
Is this home right for you?
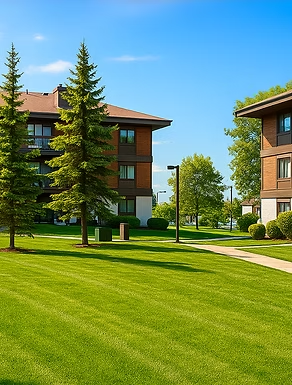
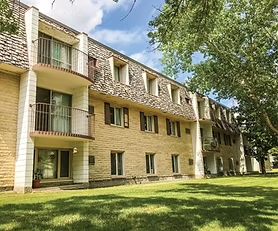
Property Overview: 99 Ulster Street, Fort Richmond, Winnipeg
Key Characteristics & Appeal
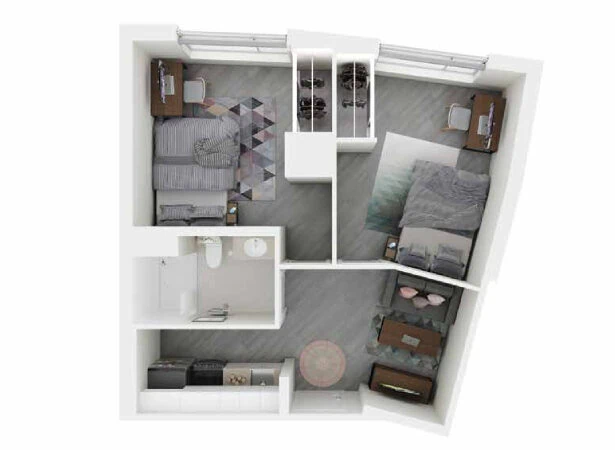
This 1,193 sqft condo in Fort Richmond presents a compelling blend of space, value, and location. Its primary appeal lies in its above-average living area, which ranks in the top tier for both the immediate street and the wider Fort Richmond area, offering more room than most comparable local homes. The property features a renovated basement, adding functional living space. Built in 1977, it is a well-established home in a mature neighbourhood.
The data suggests a strong value proposition. The assessed value is notably high for Fort Richmond (ranking in the top 5%), indicating official recognition of its worth relative to the area, while its recent sold price range aligns with city-wide averages. This positions the home as a premium property within its community that is still accessibly priced in the broader Winnipeg market.
This condo would suit practical buyers looking for space without the upkeep of a house, such as small families, downsizers, or professionals seeking a roomy, low-maintenance home in a quiet, established suburb. It’s particularly suited for those who value quantifiable metrics—seeing that they are getting more square footage than most neighbours for their investment.
Frequently Asked Questions
1. How does the living space truly compare to other homes?
At 1,193 sqft, this condo is larger than approximately 80% of similar properties on its street, 99% in Fort Richmond, and 73% city-wide, making it a notably spacious unit for the area.
2. What does the "Elite" assessed value ranking mean for Fort Richmond?
A top 5% assessment rank locally suggests the municipal valuation is significantly higher than the area's typical condo. This often reflects the unit's larger size and renovations, which could be a positive for equity, but it's important to consider how this affects property taxes.
3. Is the 1977 build year a concern?
While older than the city average, the building's age is actually above average for its own street and neighbourhood. This is typical for Fort Richmond. The key points to investigate are the building's reserve fund study, recent major repairs (like roofing or windows), and the condition of the renovated basement.
4. What can the recent sold price range tell me?
The listed range (29.5k – 32.5k) from late 2024 provides a recent market benchmark. The fact that it falls within the city-wide average for comparable homes, despite the unit's above-average size for its area, may indicate an opportunity for value.
5. Why is the city-wide ranking for Assessed Value lower than the local ranking?
This is a key insight. The property is a high-value home within Fort Richmond (top 5%), but when compared to all Winnipeg condos, it ranks around the middle (top 37%). This highlights that you are purchasing a premium property in a more affordable suburb, rather than a similarly priced condo in a more expensive city district.