Property score
How it stacks up
Detailed ranking analysis ▼
Street Level (Ulster Street): Around Average. Ranked #2 out of 5 (Top 40%). The street average for comparable homes is 1,120 sqft.
Neighborhood Level (Fort Richmond): Above Average. Ranked #43 out of 653 (Top 7%). The neighborhood average for comparable homes is 894 sqft.
Citywide Level (Winnipeg): Around Average. Ranked #9,738 out of 26,841 (Top 36%). The citywide average for comparable homes is 1,042 sqft.
Street Level (Ulster Street): Around Average. Ranked #2 out of 5 (Top 40%). The street average for comparable homes is 304.8k.
Neighborhood Level (Fort Richmond): Above Average. Ranked #7 out of 653 (Top 1%). The neighborhood average for comparable homes is 185.3k.
Citywide Level (Winnipeg): Around Average. Ranked #8,320 out of 26,841 (Top 31%). The citywide average for comparable homes is 276.9k.
Street Level (Ulster Street): Above Average. Ranked #1 out of 5 (Top 20%). The street average for comparable homes is 1977.
Neighborhood Level (Fort Richmond): Around Average. Ranked #184 out of 653 (Top 28%). The neighborhood average for comparable homes is 1980.
Citywide Level (Winnipeg): Below Average. Ranked #18,777 out of 26,841 (Bottom 30%). The citywide average for comparable homes is 1990.
Fort Richmond market pulse
How to read: Share of sales in each ~$50k price band for “fort richmond” (Condos, 2024). The tallest band is the mainstream budget range; multi-year view shows how that band shifts over time.
- Exact sold prices
- Detailed market analysis
- PDF report download
- Neighbourhood insights
- Recent sold count in the area
A quick signal for rental-market activity, potential tenant demand, and rental competition around this home.
View Winnipeg rental map →Who lives in this neighbourhood
Transit, amenities & safety
Nearby Amenities
91 Ulster Street — 28 amenities found within 500 m, across 6 categories, including 13 dining (nearest 292 m), 4 education (nearest 282 m), 4 healthcare (nearest 173 m).
Crime & safety
We are licensed Manitoba real estate agents. Contact us to obtain all MLS whole sold records for 91 Ulster Street. No advertising. Data source details →
Related homes
Nearby interested homes
Address · Year Built · Living Area
Nearby properties
Address · Distance
Similar assessed value
Address · Tax-Assessed Value
Is this home right for you?
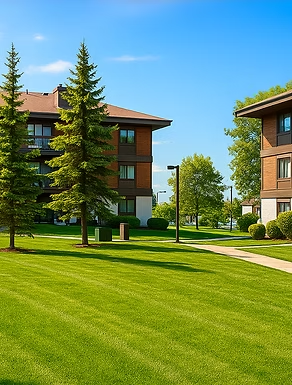
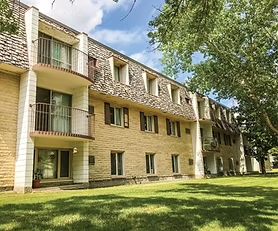
Property Overview: 91 Ulster Street, Fort Richmond, Winnipeg
Section 1: Key Characteristics & Appeal
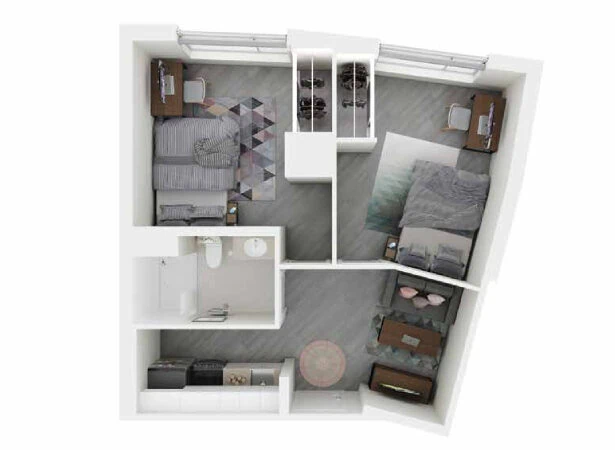
This 1,102 sqft condo at 91 Ulster Street presents a solid, mid-sized living space in the established Fort Richmond neighborhood. Its key appeal lies in its relative value and above-average positioning within the local market. The home was built in 1977 and features a renovated basement, adding functional living space.
The data suggests a property that stands out more within its immediate area than citywide. Its assessed value ranks in the top 6% for Fort Richmond, indicating it is considered a higher-value home for the neighborhood. Similarly, its living area is well above the local average. This creates an interesting dynamic: you get more space and perceived value for the area compared to many nearby properties, while the metrics are more in line with city-wide averages. It’s a home that offers a strong foothold in a specific community.
This property would suit a practical buyer looking for a spacious condo in a mature neighborhood, potentially a first-time homeowner, downsizer, or investor attracted to its renovated basement and strong standing within Fort Richmond. It’s for someone who values neighborhood comparables over flashy city-wide rankings.
Section 2: Frequently Asked Questions
1. How does this home’s value compare to others on the street?
It ranks around the average for Ulster Street specifically, but its assessed value is significantly higher than the average for all of Fort Richmond. This suggests the street itself consists of well-valued properties.
2. What does the sold price history indicate?
The home sold in late 2019 for an estimated range of $185k-$215k. The current assessed value is $262k. This increase reflects broader market trends, but for precise historical pricing, the listing service offers to provide exact sold prices upon request.
3. Is a home built in 1977 a concern?
The year built (1977) is actually above average for both the street and Fort Richmond, meaning the neighborhood is largely comprised of homes from this era or older. Prospective buyers should focus on the condition of major systems (roof, windows, plumbing) and the noted basement renovation.
4. What is the significance of the ranking data?
The rankings compare the home against three groups: its immediate street, the Fort Richmond area, and all of Winnipeg. The data shows this property is particularly strong within Fort Richmond itself, offering more space and a higher assessed value than most local peers.
5. Who manages the condo corporation and what are the fees?
This information is not provided in the available details. A crucial next step for any serious buyer is to review the condo corporation's financial statements, bylaws, and reserve fund study, as well as understand the monthly fee structure and what it covers.