58 Dalhousie Drive

Built 1977Living Area 1,102 sqft
Sale History
SOLDin Jun 2016
200K±5,000
Tax Assessment
278k(prev. 238k)
+40k(+16.8%)
DateSold PriceNeighbourhood
2016-06Sold200K±5,0009/50

Rankings reflect the property's sold price position within its street, neighbourhood, and all of Winnipeg in the year of sale.

Map
Above average1,102 sqft · top 7% in area · built 1977 · 3 yrs older than avg
$
High-income areaMedian household income ~$55K · top tier income demographics
1-min walk to transit2 nearby routes · score 82/100
Score

Property score

Overall score
61Fair
How is the score calculated? ▼
Scores are weighted aggregates of property attributes (size, age, lot, sales activity) and community signals from the 2021 Statistics Canada census (income, education, housing stress, employment). 100 = top of metric within Winnipeg.
Property Score
63
Fair
Living area
60
Year built
67
Sales activity
78
Community Score
57.9
Fair
Income
60
Education
72
Housing
30
Core need
63
Employment
42
Rankings

How it stacks up

Each metric compared against 62 homes on Dalhousie Drive, 653 in Fort Richmond, and 26,841 citywide. Polygon points further from the centre = better rank.
Living Area
1,102 sqft
ABOVE AVERAGE
StreetTop 16%AreaTop 7%CityTop 36%
Same street
Top 16%
#10 / 62
Same area
Top 7%
#43 / 653
Citywide
Winnipeg
Top 36%
#9,738 / 26,841
Tax-Assessed Value
278 k
ABOVE AVERAGE
StreetTop 11%AreaTop 7%CityTop 40%
Same street
Top 11%
#7 / 62
Same area
Top 7%
#44 / 653
Citywide
Winnipeg
Top 40%
#10,763 / 26,841
Year Built
1977
NEAR AVERAGE
StreetBottom 10%AreaTop 28%CityBottom 30%
Same street
Bottom 10%
#56 / 62
Same area
Top 28%
#184 / 653
Citywide
Winnipeg
Bottom 30%
#18,777 / 26,841
How rankings work — each polygon vertex is the property's percentile rank within that scope. Further from the centre = better.
Detailed ranking analysis ▼
58 Dalhousie Drive: Living Area Analysis

Street Level (Dalhousie Drive): Above Average. Ranked #10 out of 62 (Top 16%). The street average for comparable homes is 897 sqft.

Neighborhood Level (Fort Richmond): Above Average. Ranked #43 out of 653 (Top 7%). The neighborhood average for comparable homes is 894 sqft.

Citywide Level (Winnipeg): Around Average. Ranked #9,738 out of 26,841 (Top 36%). The citywide average for comparable homes is 1,042 sqft.

58 Dalhousie Drive: Tax-Assessed Value Analysis

Street Level (Dalhousie Drive): Above Average. Ranked #7 out of 62 (Top 11%). The street average for comparable homes is 212.0k.

Neighborhood Level (Fort Richmond): Above Average. Ranked #44 out of 653 (Top 7%). The neighborhood average for comparable homes is 185.3k.

Citywide Level (Winnipeg): Around Average. Ranked #10,763 out of 26,841 (Top 40%). The citywide average for comparable homes is 276.9k.

58 Dalhousie Drive: Year Built Analysis

Street Level (Dalhousie Drive): Below Average. Ranked #56 out of 62 (Bottom 10%). The street average for comparable homes is 1991.

Neighborhood Level (Fort Richmond): Around Average. Ranked #184 out of 653 (Top 28%). The neighborhood average for comparable homes is 1980.

Citywide Level (Winnipeg): Below Average. Ranked #18,777 out of 26,841 (Bottom 30%). The citywide average for comparable homes is 1990.

Market

Fort Richmond market pulse

Past 14 years sales snapshot (~80% of all data)
Sold count
434
last 14 years
Median price
159.2k
14-year area median
Price per sqft
$183/sqft
area average
Avg build year
1980
area average
Market conditions · Winnipeg
Sales-to-New-Listings?
Seller's market
67.9%
Buyer'sBalancedSeller's
Sold
1,822
New listings
2,684
Sold above asking?
Last 7 days
Majority over ask
56%
Below ask56% above
79 of 141 sold above asking
What this means
Upward pressure
Demand is clearly outpacing supply. Buyers are competing, which is putting upward pressure on prices.
2026-05

How to read: Share of sales in each ~$50k price band for “fort richmond” (Condos, 2024). The tallest band is the mainstream budget range; multi-year view shows how that band shifts over time.

Unlock exact sold price & PDF analysis
  • Exact sold prices
  • Detailed market analysis
  • PDF report download
  • Neighbourhood insights
  • Recent sold count in the area
Free · No credit card required
Weekly report
Winnipeg Market Report — Jun 8–14, 2026
Winnipeg's market remained active this week, with 56% of homes selling over asking and a stable $455,000 median sold price. But the premium was thinner than the previous sample: the median over-ask result was +$11,000, not a runaway bidding market across the board. For sellers, the message is still timing and pricing. The first 10 days remain the strongest window for competition. After that, the probability of a discount rises quickly. For buyers, the best opportunities are not necessarily in the cheapest homes, but in listings that have missed the early bidding window. Once a home sits beyond two weeks, negotiation room becomes much more visible.
Realtor recommended · 1 / 2
4 Bedrooms, Steps from U of M An Ideal Home for Living or Renting
In-depth Fort Richmond home review near University of Manitoba. 4-bed detached, 1,921 sqft, public sales records in 2016
Read review →
Monthly report
Highest May Detached Average on Record $477,313
Winnipeg Real Estate Market Data · May 2026 : Average sets a record May, recovery signals converge — 2026's first month with sales above the 5-year average. Detached $477,313 (highest May on record) · Condo $294,703 (just shy of the 2025 record) Three "2026 firsts": sales above 5-yr avg · listings above last year · Condo sales above last year
Nearby rentals?
Apartments within 2 km
2 km
20
Buildings
11
Available
$799 - $1,881
Rent range

A quick signal for rental-market activity, potential tenant demand, and rental competition around this home.

View Winnipeg rental map →
Community deep dive

Who lives in this neighbourhood

Dissemination area #46111019 · Statistics Canada 2021 Census · Population 1244
1,244
Population (2021)
25.0
Median age
2.9
Avg household size
3,769 / km²
Population density
Distribution by household income band
0-5k
9%
5k-10k
2%
10k-15k
1%
15k-20k
2%
20k-25k
3%
25k-30k
4%
30k-35k
4%
35k-40k
4%
40k-45k
7%
45k-50k
6%
50k-60k
12%
60k-70k
9%
70k-80k
9%
80k-90k
6%
90k-100k
3%
100k-125k
8%
125k-150k
4%
150k-200k
3%
200k plus
1%
$55K
Median household income
$60K
Average household income
37%
Low income (LIM-AT)
0.3
Income inequality (Gini)
4.7
P90 / P10 ratio
20%
Single-person households
26%
Families with children
65%
Labour participation
21%
Unemployment
Local · Day-to-day

Transit, amenities & safety

Everything within walking distance, plus crime and waste collection.

Nearby Amenities

Dining, education, healthcare, shopping & more

58 Dalhousie Drive — 28 amenities found within 500 m, across 6 categories, including 13 dining (nearest 292 m), 4 education (nearest 282 m), 4 healthcare (nearest 173 m).

Search radius
🍽️Dining13
🏫Education4
🏥Healthcare4
🌳Parks2
🏦Finance1
Worship4

Crime & safety

Fort Richmond · WPS public data
Full crime data →
Annual incidents
38
2026
vs. city average
+29%
▲ relative to avg
Year-over-year
▼ -95%
vs. prior year
Primary type
Property
55% of incidents

Waste collection schedule

Local garbage, recycling, and yard waste pickup
Recycling
wednesday

We are licensed Manitoba real estate agents. Contact us to obtain all MLS whole sold records for 58 Dalhousie Drive. No advertising. Data source details →

Related homes

Highlights & common questions

Is this home right for you?

Property highlights

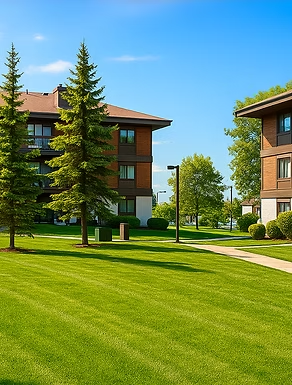
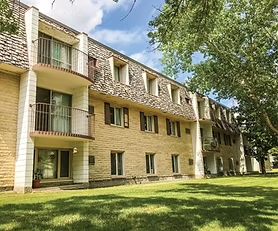
Property Overview: 58 Dalhousie Drive, Fort Richmond, Winnipeg

Key Characteristics & Appeal

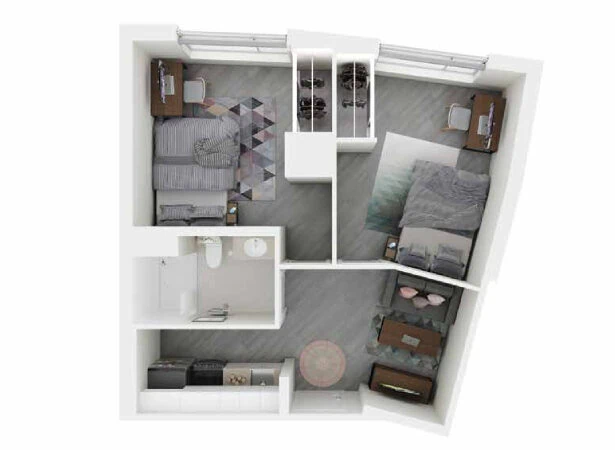
This is a 1,102 sqft condominium with a basement, built in 1977. Its primary appeal lies in its above-average space and value within its immediate neighborhood. The living area is notably larger than most comparable homes on its street and in Fort Richmond, placing it in the top 16% and 7% locally, respectively. Similarly, its assessed value ranks above the local averages. This suggests you get more square footage for your dollar in this specific area compared to peers.

The home suits practical buyers looking for space and value in a established neighborhood. It's ideal for a first-time buyer or an investor seeking a condo with a solid footprint without a premium price tag. A less obvious angle is its potential for a buyer comfortable with a property from the 1970s; while the basement is noted as unrenovated, the core living space offers a generous canvas for updates tailored to personal taste. It represents a classic trade-off: a newer build might offer modern finishes, but this property provides more room in a sought-after location.


Frequently Asked Questions

1. Is this a good value for the area?
The data indicates it is. Both the living area and assessed value rank above average for Dalhousie Drive and the wider Fort Richmond neighborhood, suggesting you're getting more space relative to the local market value.

2. What does the "Top X%" ranking mean?
It shows how this property compares to similar homes. For example, "Top 16% for Living Area" means approximately 84% of comparable homes on the same street are smaller. The badges (gold, blue, gray) give a quick visual cue for performance.

3. The home was built in 1977. Is that a concern?
It is older than many homes on its street (ranking in the top 90%, meaning 90% are newer). This typically means maintenance and systems should be carefully evaluated. However, its strong rankings for size and value show that age is already factored into its market position.

4. Why is the sold price history shown as a range?
The provided ranges are based on publicly available data. To obtain the exact historical sold prices, you must request them via email. The service is manual, with no attached marketing spam.

5. Who would this property not suit?
It may not suit buyers seeking a modern, turn-key home or those wary of potential renovation projects, given its age and unrenovated basement. It also ranks as average city-wide for size and value, so buyers comparing across all of Winnipeg may find newer or larger options in other areas.