Property score
How it stacks up
Detailed ranking analysis ▼
Street Level (Thornhill Bay): Below Average. Ranked #23 out of 45 (Bottom 49%). The street average for comparable homes is 1,328 sqft.
Neighborhood Level (Fort Richmond): Below Average. Ranked #1,660 out of 2,629 (Bottom 37%). The neighborhood average for comparable homes is 1,421 sqft.
Citywide Level (Winnipeg): Around Average. Ranked #97,378 out of 194,457 (Top 50%). The citywide average for comparable homes is 1,342 sqft.
Street Level (Thornhill Bay): Below Average. Ranked #43 out of 45 (Bottom 4%). The street average for comparable homes is 449.4k.
Neighborhood Level (Fort Richmond): Below Average. Ranked #2,293 out of 2,629 (Bottom 13%). The neighborhood average for comparable homes is 468.9k.
Citywide Level (Winnipeg): Below Average. Ranked #105,928 out of 194,455 (Bottom 46%). The citywide average for comparable homes is 435.4k.
Street Level (Thornhill Bay): Above Average. Ranked #1 out of 45 (Top 2%). The street average for comparable homes is 1976.
Neighborhood Level (Fort Richmond): Above Average. Ranked #410 out of 2,629 (Top 16%). The neighborhood average for comparable homes is 1972.
Citywide Level (Winnipeg): Around Average. Ranked #72,028 out of 194,457 (Top 37%). The citywide average for comparable homes is 1966.
Street Level (Thornhill Bay): Around Average. Ranked #12 out of 45 (Top 27%). The street average for comparable homes is 6,504 sqft.
Neighborhood Level (Fort Richmond): Below Average. Ranked #1,888 out of 2,629 (Bottom 28%). The neighborhood average for comparable homes is 7,381 sqft.
Citywide Level (Winnipeg): Around Average. Ranked #48,590 out of 194,457 (Top 25%). The citywide average for comparable homes is 6,570 sqft.
Fort Richmond market pulse
How to read: Share of sales in each ~$50k price band for “fort richmond” (Detached houses (non-condo), 2024). The tallest band is the mainstream budget range; multi-year view shows how that band shifts over time.
- Exact sold prices
- Detailed market analysis
- PDF report download
- Neighbourhood insights
- Recent sold count in the area
A quick signal for rental-market activity, potential tenant demand, and rental competition around this home.
View Winnipeg rental map →Who lives in this neighbourhood
Transit, amenities & safety
Nearby Amenities
59 Thornhill Bay — 2 amenities found within 500 m, across 2 categories, including 1 education (nearest 367 m), 1 parks (nearest 324 m).
Crime & safety
Waste collection schedule
We are licensed Manitoba real estate agents. Contact us to obtain all MLS whole sold records for 59 Thornhill Bay. No advertising. Data source details →
Related homes
Nearby interested homes
Address · Year Built · Living Area
Nearby properties
Address · Distance
Similar assessed value
Address · Tax-Assessed Value
Is this home right for you?
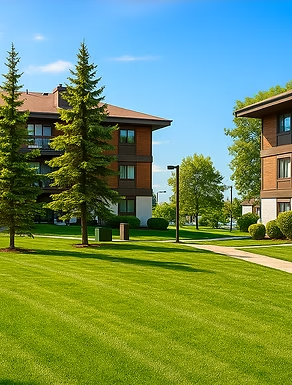
Property Overview: 59 Thornhill Bay, Fort Richmond, Winnipeg
Section 1: Key Characteristics & Appeal
This one-storey home in Fort Richmond presents a practical and straightforward opportunity. Built in 1977, it is notably newer than many homes on its street and in the wider area, which can be an advantage for systems and structure. With 1,200 sqft of living space and a full, unrenovated basement, it offers room to grow or customize. The lot size of over 6,300 sqft is a standout feature, providing ample outdoor space that is larger than many city-wide comparables—a valuable asset for gardening, play, or future expansion.
The primary appeal lies in its value proposition and potential. The home’s assessed value is positioned below average for the immediate neighborhood, suggesting a potentially accessible entry point into the Fort Richmond area. This setup is ideal for a first-time buyer, an investor, or a hands-on homeowner who sees value in a solid, newer-vintage structure on a generous lot and is prepared to update the interior over time. Its appeal is less about immediate move-in readiness and more about the foundational strengths: a newer build year and a sizable parcel of land in a well-established community.
Section 2: Frequently Asked Questions
1. Is the low assessed value a concern?
Not necessarily. While it ranks below the street and area averages, this often reflects the home’s current condition and lack of recent renovations rather than a problem with the property itself. It can represent a value opportunity in a desirable location.
2. What does "basement yes, not renovated" imply?
It confirms the home has a full basement, but it is in original or functional condition without finished living space. This is a blank canvas for future development, storage, or utility space, but will require investment to modernize.
3. How does the 1977 build year compare?
This is a relative strength. The home is newer than most on its street (top 2%) and in Fort Richmond, which can mean more modern construction standards and potentially fewer immediate major repairs compared to older homes.
4. What is the significance of the lot size?
At over 6,300 sqft, the lot is larger than many city-wide averages. This is a less obvious but significant perk, offering more private outdoor space and future potential than is typical, which is often a premium in established neighborhoods.
5. Who would this property suit best?
It best suits a value-conscious buyer prioritizing land size and a sound building foundation over turn-key finishes. It’s a match for someone comfortable with a project, whether as a long-term home to personalize or a strategic investment property.