Sold for $250,000 over asking
Winnipeg Weekly Real Estate Market Report
May 11 – May 17, 2026
This summary is based on residential and condominium sales in Winnipeg during the week of May 11 – May 17, 2026. The data has been manually compiled to reflect actual market activity, focusing on pricing behaviour, demand levels, and transaction patterns. While every effort has been made to ensure accuracy, this should be considered a general market reference rather than real estate advice.
🌡️ Market Temperature Snapshot
| Indicator | This Week | Reading |
|---|---|---|
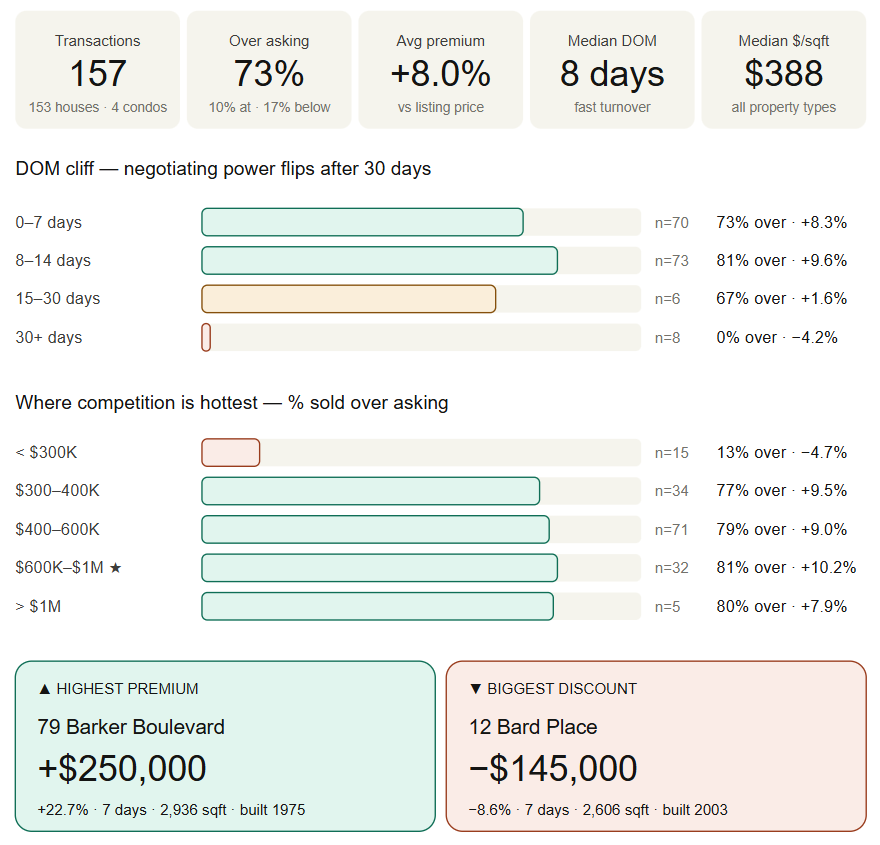
| Properties Tracked | 157 | — |
| Sold Over Asking | ~73% | 🔥 Seller's market |
| Median Days on Market | 8 days | Fast turnover |
| Average Premium | +8.0% | Sustained pressure |
| Median $/sqft | ~$388 | — |
Verdict: Winnipeg remains a firm seller's market, but with clear segmentation — the heat is heavily concentrated in mid-to-upper detached homes, while condos and entry-level homes (<$300K) show notable cooling.
1. Overall Market Summary
- Total Transactions: 157 properties
- Property Mix: Houses ~97.5% (153) | Condos ~2.5% (4)
- Average Sale Price: ~$506K
- Median Sale Price: ~$469K
- Year Built Range: 1900 to 2026 construction
- Above Asking: ~73% | At Asking: ~10% | Below Asking: ~17%
Detached homes overwhelmingly dominate market activity. Condos are a very small share of weekly transactions and — as detailed in Section 7 — are no longer competing on price with detached stock.
2. The DOM Tipping Point ⚠️
The most actionable pattern of the week: there is a clear cliff in negotiating power once a listing crosses the two-week mark, and an outright collapse beyond 30 days.
| Days on Market | # Properties | Avg Premium | % Sold Over Asking |
|---|---|---|---|
| 0–7 days | 70 | ~+8.3% | ~73% |
| 8–14 days | 73 | ~+9.6% | ~81% |
| 15–30 days | 6 | ~+1.6% | ~67% |
| 30+ days | 8 | ~−4.2% | 0% |
Key insight: Properties that sell within 14 days command the strongest premiums (8–10% over asking, 73–81% closing above list). Beyond 14 days, premiums fall sharply, and once a listing crosses 30 days, not a single one closed above asking — and the average closing price was 4% below list.
Implication for sellers: Have a Plan B ready by Day 10 (price adjustment, staging refresh, marketing push). After Day 30, expect to give back 4–10% or more.
3. Sold Price vs List Price
The market favoured sellers again this week, but with a meaningful tail of underperformers.
- ~73% of properties sold above asking
- ~10% sold at asking
- ~17% sold below asking
Highest Premium (Percentage)
| Address | Premium |
|---|---|
| 325 Larche Crescent | +32.0% |
| 15 Stoneham Crescent | +31.8% |
| 242 Queen Street | +29.0% |
| 50 Haig Avenue | +27.1% |
| 1190 Grosvenor Avenue | +26.0% |
Highest Premium (Amount)
| Address | Price Difference |
|---|---|
| 79 Barker Boulevard | +$250,000 (+22.7%) |
| 15 Stoneham Crescent | +$178,100 (+31.8%) |
| 27 Elstree Court | +$175,155 (+21.9%) |
| 1190 Grosvenor Avenue | +$156,100 (+26.0%) |
| 306 Brock Street | +$146,750 (+21.6%) |
Largest Discounts 🔻
| Address | Discount | DOM |
|---|---|---|
| 395 Toronto Street | −21.4% (−$29,900) | 29 days |
| 563 Aberdeen Avenue | −15.2% (−$12,900) | 39 days |
| #9 183 Harrow Street (condo) | −11.0% (−$14,900) | 0 days |
| #114 235 Bridgeland Drive (condo) | −10.5% (−$27,400) | 8 days |
| 12 Bard Place | −8.6% (−$145,000) | 7 days |
| 164 Parkview Street | −8.8% (−$14,900) | 33 days |
Pattern: The deepest percentage discounts cluster at the low end — older properties below $250K, where buyer pools are smaller and condition issues weigh heavier. The largest dollar discount of the week (12 Bard Place, −$145K) came from the luxury tier, where a single mispriced listing can swing the segment. Mid-range homes ($300K–$1M) rarely traded below asking.
4. Price Segment Heat Map
Beyond volume, this table shows where competition is most intense.
| Price Range | # Sold | Share | % Over Asking | Avg Premium | Avg DOM |
|---|---|---|---|---|---|
| < $300K | 15 | ~10% | ~13% | ~−4.7% | ~15 days |
| $300K – $400K | 34 | ~22% | ~77% | ~+9.5% | ~7 days |
| $400K – $600K | 71 | ~45% | ~79% | ~+9.0% | ~11 days |
| $600K – $1M ⭐ | 32 | ~20% | ~81% | ~+10.2% | ~9 days |
| > $1M | 5 | ~3% | ~80% | ~+7.9% | ~7 days |
Seller's sweet spot: $600K – $1M. This bracket combined the highest share of over-asking sales, the highest average premium, and a fast 9-day average DOM. The $300K–$600K band — the volume engine of the market — was nearly as hot. The only weak segment is sub-$300K, where buyer demand thins out and most listings closed below asking.
5. Era / Build Year Performance
A counter-intuitive but consistent finding:
| Era | # Sold | Avg Premium | Median $/sqft |
|---|---|---|---|
| Pre-1950 | 31 | ~+5.8% | ~$321 |
| 1950 – 1980 ⭐ | 56 | ~+10.6% | ~$397 |
| 1980 – 2010 | 50 | ~+9.1% | ~$413 |
| 2010 onward | 19 | ~+2.2% | ~$347 |
Post-war homes (1950s–1970s) are the most competitively bid asset in Winnipeg right now. Newer 2010+ construction sold at premiums of just over 2% on average — most went at or barely above asking. Several brand-new builds (1096 Fernbank, 14 Duck Creek, 130 Bill Briercliffe) sold at or just below list with extended DOM.
This pattern likely reflects (a) attractive entry prices in older neighbourhoods, (b) buyers willing to renovate, and (c) limited bidding pressure on new builds where pricing is already calibrated to current values.
6. $/sqft Reference Table
For quick valuation benchmarking:
| Segment | Median $/sqft |
|---|---|
| All Properties | ~$388 |
| Pre-1950 stock | ~$321 |
| 1950–1980 stock | ~$397 |
| 1980–2010 stock | ~$413 |
| Post-2010 construction | ~$347 |
| 25th percentile (all) | ~$332 |
| 75th percentile (all) | ~$443 |
Listings substantially below segment median may be candidates for bidding wars; those well above warrant scrutiny of unique features or potential overpricing.
7. House vs Condo Spotlight
A divergence worth flagging — condos materially underperformed houses this week.
| Type | # Sold | Avg Price | Avg Premium | Avg DOM |
|---|---|---|---|---|
| Detached House | 153 | ~$511K | ~+8.3% | ~10 days |
| Condo | 4 | ~$321K | ~−4.0% | ~6 days |
The condo sample is very small (n=4), so treat the figure as directional rather than definitive. Still, the direction is unambiguous: of four condo transactions, only one (#9 20 Orchard Hill Drive) closed meaningfully above asking; two sold materially below. Condo sellers should price defensively and not expect bidding wars.
8. Key Takeaways (Actionable)
- 🎯 $600K–$1M is the hottest band this week — 81% of these listings sold above asking, with the highest average premium. The $300K–$600K volume bracket runs a close second.
- ⏱️ The 14-day rule holds, and the 30-day cliff is absolute: zero listings beyond 30 days sold above asking this week. Plan price adjustments before reaching that threshold.
- 🏠 Post-war homes (1950s–70s) carry the strongest leverage — average premium of +10.6%, well ahead of newer construction.
- 🏢 Condo sellers: price defensively. Only 1 of 4 condos closed clearly over asking.
- 💰 Sub-$300K listings are the weakest segment — average −4.7% vs list and the longest DOM. Older small properties need realistic pricing.
Summary
Well-priced mid-range and upper-mid detached homes continue to sell quickly, often with multiple offers.
Buyers remain highly active across the $300K–$1M detached market, while condos, sub-$300K listings, and aged listings (30+ days) face increasing resistance.
The 14-day mark remains the line between seller leverage and buyer leverage — and after 30 days, the negotiation power flips entirely.
Methodology Note
- Sample size: 157 transactions (153 houses, 4 condos)
- Date range: May 11 – May 17, 2026
- Source: Manually compiled MLS transaction data
- Missing fields: 2 records missing square footage and 1 missing build year; these were excluded from per-segment $/sqft and era calculations
- Rounding: Most figures rounded for readability; treat as approximate
Report prepared May 17, 2026. Not real estate or investment advice.