27 St Martin Boulevard

One StoreyBuilt 1966Living Area 954 sqftDetached Garage
Sale History
SOLDin Sep 2014
270K±5,000
Tax Assessment
380k(prev. 350k)
+30k(+8.6%)
DateSold PriceNeighbourhood
2014-09Sold270K±5,00010/84

Rankings reflect the property's sold price position within its street, neighbourhood, and all of Winnipeg in the year of sale.

Map
Near average954 sqft · top 59% in area · built 1966 · 0 yrs newer than avg
$
High-income areaMedian household income ~$86K · top tier income demographics
5-min walk to transit2 nearby routes · score 74/100
Score

Property score

Overall score
56.8Fair
How is the score calculated? ▼
Scores are weighted aggregates of property attributes (size, age, lot, sales activity) and community signals from the 2021 Statistics Canada census (income, education, housing stress, employment). 100 = top of metric within Winnipeg.
Property Score
48.1
Low
Living area
42
Year built
52
Lot size
74
Sales activity
28
Community Score
69.8
Fair
Income
79
Education
22
Housing
83
Core need
100
Employment
76
Rankings

How it stacks up

Each metric compared against 105 homes on St Martin Boulevard, 2,178 in Kildare-Redonda, and 194,457 citywide. Polygon points further from the centre = better rank.
Living Area
954 sqft
BELOW AVERAGE
StreetBottom 44%AreaBottom 41%CityBottom 22%
Bottom 44%
#59 / 105
Bottom 41%
#1,286 / 2,178
Citywide
Winnipeg
Bottom 22%
#152,512 / 194,457
Tax-Assessed Value
380 k
ABOVE AVERAGE
StreetTop 18%AreaTop 15%CityBottom 42%
Top 18%
#19 / 105
Top 15%
#336 / 2,178
Citywide
Winnipeg
Bottom 42%
#112,256 / 194,455
Year Built
1966
NEAR AVERAGE
StreetBottom 30%AreaTop 47%CityBottom 48%
Bottom 30%
#73 / 105
Top 47%
#1,023 / 2,178
Citywide
Winnipeg
Bottom 48%
#101,127 / 194,457
Lot Size
5,999 sqft
ABOVE AVERAGE
StreetTop 10%AreaTop 14%CityTop 32%
Top 10%
#10 / 105
Top 14%
#311 / 2,178
Citywide
Winnipeg
Top 32%
#61,607 / 194,457
How rankings work — each polygon vertex is the property's percentile rank within that scope. Further from the centre = better.
Detailed ranking analysis ▼
27 St Martin Boulevard: Living Area Analysis

Street Level (St Martin Boulevard): Below Average. Ranked #59 out of 105 (Bottom 44%). The street average for comparable homes is 979 sqft.

Neighborhood Level (Kildare-Redonda): Below Average. Ranked #1,286 out of 2,178 (Bottom 41%). The neighborhood average for comparable homes is 966 sqft.

Citywide Level (Winnipeg): Below Average. Ranked #152,512 out of 194,457 (Bottom 22%). The citywide average for comparable homes is 1,342 sqft.

27 St Martin Boulevard: Tax-Assessed Value Analysis

Street Level (St Martin Boulevard): Above Average. Ranked #19 out of 105 (Top 18%). The street average for comparable homes is 333.6k.

Neighborhood Level (Kildare-Redonda): Above Average. Ranked #336 out of 2,178 (Top 15%). The neighborhood average for comparable homes is 340.8k.

Citywide Level (Winnipeg): Below Average. Ranked #112,256 out of 194,455 (Bottom 42%). The citywide average for comparable homes is 435.4k.

27 St Martin Boulevard: Year Built Analysis

Street Level (St Martin Boulevard): Below Average. Ranked #73 out of 105 (Bottom 30%). The street average for comparable homes is 1971.

Neighborhood Level (Kildare-Redonda): Around Average. Ranked #1,023 out of 2,178 (Top 47%). The neighborhood average for comparable homes is 1966.

Citywide Level (Winnipeg): Below Average. Ranked #101,127 out of 194,457 (Bottom 48%). The citywide average for comparable homes is 1966.

27 St Martin Boulevard: Lot Size Analysis

Street Level (St Martin Boulevard): Above Average. Ranked #10 out of 105 (Top 10%). The street average for comparable homes is 4,640 sqft.

Neighborhood Level (Kildare-Redonda): Above Average. Ranked #311 out of 2,178 (Top 14%). The neighborhood average for comparable homes is 5,085 sqft.

Citywide Level (Winnipeg): Around Average. Ranked #61,607 out of 194,457 (Top 32%). The citywide average for comparable homes is 6,570 sqft.

Market

Kildare-Redonda market pulse

Past 14 years sales snapshot (~80% of all data)
Sold count
723
last 14 years
Median price
355.5k
14-year area median
Price per sqft
$372/sqft
area average
Avg build year
1966
area average
Market conditions · Winnipeg
Sales-to-New-Listings?
Seller's market
67.9%
Buyer'sBalancedSeller's
Sold
1,822
New listings
2,684
Sold above asking?
Last 7 days
Majority over ask
56%
Below ask56% above
79 of 141 sold above asking
What this means
Upward pressure
Demand is clearly outpacing supply. Buyers are competing, which is putting upward pressure on prices.
2026-05

How to read: Share of sales in each ~$50k price band for “kildare-redonda” (Detached houses (non-condo), 2024). The tallest band is the mainstream budget range; multi-year view shows how that band shifts over time.

Unlock exact sold price & PDF analysis
  • Exact sold prices
  • Detailed market analysis
  • PDF report download
  • Neighbourhood insights
  • Recent sold count in the area
Free · No credit card required
Weekly report
Winnipeg Market Report — Jun 8–14, 2026
Winnipeg's market remained active this week, with 56% of homes selling over asking and a stable $455,000 median sold price. But the premium was thinner than the previous sample: the median over-ask result was +$11,000, not a runaway bidding market across the board. For sellers, the message is still timing and pricing. The first 10 days remain the strongest window for competition. After that, the probability of a discount rises quickly. For buyers, the best opportunities are not necessarily in the cheapest homes, but in listings that have missed the early bidding window. Once a home sits beyond two weeks, negotiation room becomes much more visible.
Realtor recommended · 1 / 2
4 Bedrooms, Steps from U of M An Ideal Home for Living or Renting
In-depth Fort Richmond home review near University of Manitoba. 4-bed detached, 1,921 sqft, public sales records in 2016
Read review →
Monthly report
Highest May Detached Average on Record $477,313
Winnipeg Real Estate Market Data · May 2026 : Average sets a record May, recovery signals converge — 2026's first month with sales above the 5-year average. Detached $477,313 (highest May on record) · Condo $294,703 (just shy of the 2025 record) Three "2026 firsts": sales above 5-yr avg · listings above last year · Condo sales above last year
Nearby rentals?
Apartments within 2 km
2 km
4
Buildings
1
Available
$1,200 - $1,844
Rent range

A quick signal for rental-market activity, potential tenant demand, and rental competition around this home.

View Winnipeg rental map →
Community deep dive

Who lives in this neighbourhood

Dissemination area #46110847 · Statistics Canada 2021 Census · Population 392
392
Population (2021)
40.0
Median age
2.5
Avg household size
3,015 / km²
Population density
Distribution by household income band
25k-30k
3%
30k-35k
3%
35k-40k
3%
40k-45k
6%
45k-50k
3%
50k-60k
9%
60k-70k
9%
70k-80k
6%
80k-90k
9%
90k-100k
6%
100k-125k
13%
125k-150k
13%
150k-200k
13%
200k plus
3%
$86K
Median household income
$102K
Average household income
10%
Low income (LIM-AT)
0.2
Income inequality (Gini)
3.2
P90 / P10 ratio
19%
Single-person households
29%
Families with children
68%
Labour participation
4%
Unemployment
Local · Day-to-day

Transit, amenities & safety

Everything within walking distance, plus crime and waste collection.

Nearby Amenities

Dining, education, healthcare, shopping & more

27 St Martin Boulevard — 12 amenities found within 500 m, across 3 categories, including 1 education (nearest 158 m), 1 shopping (nearest 382 m), 10 parks (nearest 113 m).

Search radius
🏫Education1
🛒Shopping1
🌳Parks10

Crime & safety

Kildare-Redonda · WPS public data
Full crime data →
Annual incidents
10
2026
vs. city average
-66%
▲ relative to avg
Year-over-year
▼ -94%
vs. prior year
Primary type
Property
40% of incidents

We are licensed Manitoba real estate agents. Contact us to obtain all MLS whole sold records for 27 St Martin Boulevard. No advertising. Data source details →

Related homes

Highlights & common questions

Is this home right for you?

Property highlights

Overall 56.8

Compared with neighbourhood average

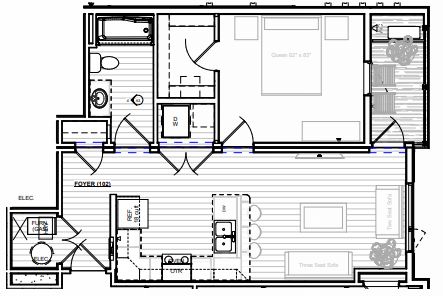
954 sqft (bottom 41%)

Built in 1966

Located in a above-average income area

with median household income of ~86k

Transit 74.0

5-min walk to transit with 2 nearby routes

Within 500m: 1 school, 1 shop, and 10 parks nearby