Property score
How it stacks up
Detailed ranking analysis ▼
Street Level (Dalhousie Drive): Around Average. Ranked #24 out of 62 (Top 39%). The street average for comparable homes is 897 sqft.
Neighborhood Level (Fort Richmond): Below Average. Ranked #357 out of 653 (Bottom 45%). The neighborhood average for comparable homes is 894 sqft.
Citywide Level (Winnipeg): Below Average. Ranked #16,374 out of 26,841 (Bottom 39%). The citywide average for comparable homes is 1,042 sqft.
Street Level (Dalhousie Drive): Below Average. Ranked #44 out of 62 (Bottom 29%). The street average for comparable homes is 212.0k.
Neighborhood Level (Fort Richmond): Around Average. Ranked #264 out of 653 (Top 40%). The neighborhood average for comparable homes is 185.3k.
Citywide Level (Winnipeg): Below Average. Ranked #19,711 out of 26,841 (Bottom 27%). The citywide average for comparable homes is 276.9k.
Street Level (Dalhousie Drive): Around Average. Ranked #22 out of 62 (Top 35%). The street average for comparable homes is 1991.
Neighborhood Level (Fort Richmond): Above Average. Ranked #74 out of 653 (Top 11%). The neighborhood average for comparable homes is 1980.
Citywide Level (Winnipeg): Below Average. Ranked #14,556 out of 26,841 (Bottom 46%). The citywide average for comparable homes is 1990.
Fort Richmond market pulse
How to read: Share of sales in each ~$50k price band for “fort richmond” (Condos, 2024). The tallest band is the mainstream budget range; multi-year view shows how that band shifts over time.
- Exact sold prices
- Detailed market analysis
- PDF report download
- Neighbourhood insights
- Recent sold count in the area
A quick signal for rental-market activity, potential tenant demand, and rental competition around this home.
View Winnipeg rental map →Who lives in this neighbourhood
Transit, amenities & safety
Nearby Amenities
1206-40 Dalhousie Drive — 27 amenities found within 500 m, across 6 categories, including 13 dining (nearest 226 m), 3 education (nearest 221 m), 5 healthcare (nearest 129 m).
Crime & safety
We are licensed Manitoba real estate agents. Contact us to obtain all MLS whole sold records for 1206-40 Dalhousie Drive. No advertising. Data source details →
Related homes
Nearby interested homes
Address · Year Built · Living Area
Nearby properties
Address · Distance
Similar assessed value
Address · Tax-Assessed Value
Is this home right for you?
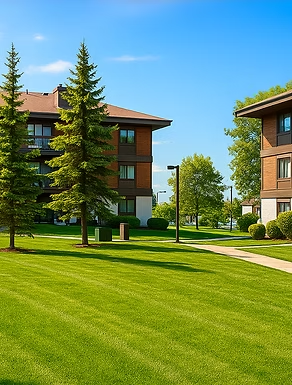
Property Overview: 1206-40 Dalhousie Drive, Fort Richmond, Winnipeg
Section 1: Key Characteristics & Appeal
This is a 902 sqft condominium in the Fort Richmond neighbourhood, built in 1986. Its key appeal lies in its practical balance of space and value within a well-established area. The living area is competitively sized, ranking above average for similar homes on its street and in the immediate area. A notable characteristic is its assessed value, which is significantly below the Winnipeg city-wide average for comparable properties. This suggests a potentially lower property tax burden and an accessible entry point into the market.
The property would suit first-time buyers or downsizers seeking a manageable, no-yard maintenance lifestyle in a mature neighbourhood near the University of Manitoba. Its value-oriented profile also appeals to pragmatic investors looking for a straightforward rental unit in a high-demand student and academic area. A less obvious perspective is that a unit with a below-average assessed value in an otherwise average-performing building can represent a relative "efficiency" within its own complex, offering similar living space for a lower ongoing cost base.
Section 2: Frequently Asked Questions
1. What are the condo fees, and what do they cover?
This information is not provided in the public data. A review of the condo corporation’s status certificate and budget is essential to understand monthly fees, reserve fund health, and what utilities or amenities (like building insurance, exterior maintenance, or common area upkeep) are included.
2. How does the below-average assessed value affect me?
A lower assessed value typically translates to lower municipal property taxes compared to similar-sized units. However, it’s important to distinguish assessed value from market value. The selling price will be determined by the current market, not the assessment.
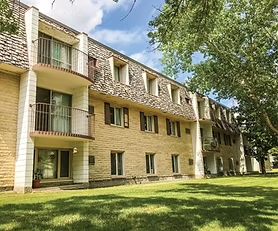
3. The building is from 1986. What should I check regarding its condition?
Given the age, inquire about the history of major capital replacements. Key questions should address the condition and replacement timeline for the roof, windows, balconies, and building envelope. The health of the condo reserve fund to cover these future projects is critical.
4. The sold price history shows a range. Why isn't the exact price listed?
Exact sale prices in Manitoba are not publicly accessible online. The provided range is an estimate based on publicly available data. You can request the precise historical sale price directly from the listing source.
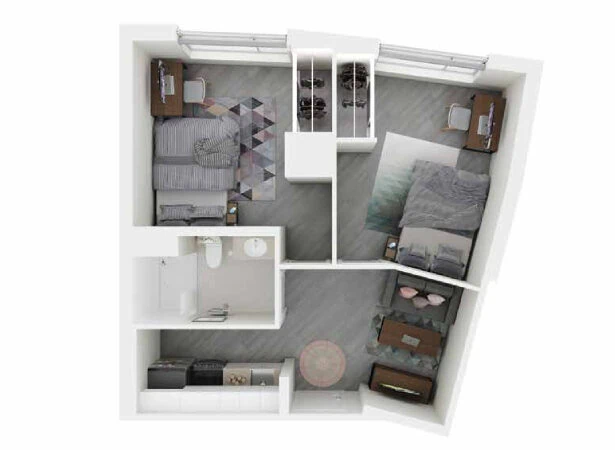
5. The unit has no basement. Where is in-suite storage located?
Without a basement, storage solutions will be limited to within the 902 sqft footprint. When viewing, pay close attention to closet space, the potential for built-in storage, and whether there is a designated locker or additional storage space elsewhere in the building.