52.3
Fair
Property score
52.3
Fair
Overall 52.3
Smaller but newer than most nearby homes
864 sqft (bottom 4%)
Built in 1921 (5 yrs newer than avg)
Located in a high-income area
with median household income of ~93k
Transit 92.0
5-min walk to transit with 5 nearby routes
Within 500m: 10 dining spots, 1 school, 3 healthcare facilitys, and 1 shop nearby
Living Area
Below average
47% smaller than neighborhood avg.
Year Built
Above average
5 yrs newer than neighborhood avg.
Mother tongue
English · 85%French · 3%
Property score
52.3 is composed by the two sections below.
Property Score
Community Score
Past 10 years Wolseley sales snapshot (~80% of all data)
820
382.5k
$285/sqft
1916
Need help understanding this property?
Buying a home is more than a transaction. Our Winnipeg real estate agents provide market insights, pricing analysis, and neighbourhood expertise to help you decide with confidence.
Usually replies in a few minutes
Get the full property report
- Exact sold prices
- Detailed market analysis
- PDF report download
- Neighbourhood insights
- Recent sold count in the area
Free · No credit card required

The real estate market is turning around
In Winnipeg this week (May 24), over-asking sales are dropping quickly.
Sales-to-New-Listings
1,465
sold
2,307
new listings
Manitoba Real Estate Association March public data on New Listings and Properties Sold across Manitoba
Sold Above Asking
Majority sold above asking
39 of 75 sold above asking · MLS Winnipeg sold listings 2026-05-18 – 2026-05-24
With a Sales-to-New-Listings ratio of 63.5% and 52% of homes selling above asking price, demand is clearly outpacing supply. Buyers are competing, which is putting upward pressure on prices.
Neighbourhood Sales
Wolseley
How to read: Share of sales in each ~$50k price band for “wolseley” (Detached houses (non-condo), 2024). The tallest band is the mainstream budget range; multi-year view shows how that band shifts over time.
Area census snapshot
Dissemination area (DA) — Statistics Canada 2021 Census · Area: #46110652
Community deep dive
$93K
Median household income
$107K
Average household income
6%
Low income (LIM-AT)
0.2
Income inequality (Gini)
2.8
P90 / P10 ratio
32%
Single-person households
29%
Families with children
Population, labour & age
Households & income
Housing
Diversity, education & language
Figures are for the census dissemination area containing this listing location; sources and margins may apply per Statistics Canada.
Rankings
Tax-Assessed Value
above averageYear Built
above averageLot Size
around averageRank by land area, larger = better rank
Rank by year, newer = better rank
Rank by living area, larger = better rank
Rank by assessed value, higher = better rank
Bar: fill length ≈ share of peers you outperform. Fill color reflects tier (red / blue / amber / gray). "Avg" is a rough median benchmark for comparable homes in that scope.
To see this property on a map next to nearby houses—and compare year built, living area, assessed value, and lot size in detail—open the neighbourhood analysis page.
Transit & Walkability
Nearby stops, routes & transit score
Nearby Amenities
Dining, education, healthcare, shopping & more
157 Garfield Street S — 25 amenities found within 500 m, across 9 categories, including 10 dining (nearest 317 m), 1 education (nearest 493 m), 3 healthcare (nearest 343 m).
Crime & Safety
Wolseley · WPS public data · 2026
Annual incidents
34
2026
vs. city avg
+15%
relative to avg
Year-over-year
▼ -95%
vs. prior year
Primary type
Property
68%
Waste Collection Schedule
Local garbage, recycling, and yard waste pickup schedule for 157 Garfield Street S.
Garbage
friday
Recycling
friday
Yard Waste
friday a
Sales History
Same street
Same area
City-wide
| Metric | Same street | Same area | City-wide |
|---|---|---|---|
Sold price | Top 42% | Bottom 17% | Bottom 27% |
We are licensed Manitoba real estate agents. Contact us to obtain all MLS whole sold records for 157 Garfield Street S. No advertising. Data source details →
Related homes
Nearby interested homes
Address · Year Built · Living Area
Nearby properties
Address · Distance
Similar assessed value
Address · Tax-Assessed Value
Highlights & common questions: 157 Garfield Street S, Winnipeg
核心特点与适合人群
这套位于温尼伯Wolseley社区、建于1921年的独立住宅,居住面积864平方英尺,土地面积3,013平方英尺。从数据看,它在几个关键指标上表现不一:居住面积在同街道和社区都低于平均水平,排在所属街道的前72%、社区的前96%;而评估总价(29万)在同街道反而高于平均水平,排在前26%,这说明同一条街上相似面积的房子,它的地税估值更高一些。建造年份在当地属于偏老一批——比社区平均(1916年)更晚,但仍然早于全市平均(1966年),房屋本身有一定历史感。土地面积在同街道和社区都接近中位数,不算突出,但放在全市看则远小于平均(6,570平方英尺),这符合中心城区老旧社区地块偏小的典型特征。
它的吸引力在于几点:一是价格门槛相对较低,评估总价低于社区和全市平均,对于预算有限的买家来说,更容易进入Wolseley这个成熟社区;二是社区本身有生活便利性,街道安静,周边配套完善;三是房子建于上世纪20年代,如果维护得当,这类老房通常有较高的改造潜力,比如增加套内面积或翻新内部。它适合首次购房者,特别是那些愿意接受较小居住面积、看重社区环境和长期增值可能性的人,也适合经验丰富的改造买家,前提是对老房维护有心理准备。对于追求“拎包入住”或大面积空间的家庭,这个房子可能不太对路。
常见问题解答
1. 这房子为什么评估总价在街道上偏高,但在社区和全市范围都偏低?
这是因为评估总价受多重因素影响,不只是居住面积。在同一条街道上,这栋房子的评估价高于平均,可能与地块条件、翻新情况或周边成交价有关;但放到社区和全市范围,Wolsele的平均房价本身更高(社区平均37.1万,全市平均39万),所以29万自然显得偏低。它反映的是相对位置,而不是房子本身的价值缺陷。
2. 房子建于1921年,会不会有老房常见的问题?
有可能。20年代的老房常见问题包括管线老化、地基裂缝、石棉保温材料(如果未更换过)、以及墙体内缺少现代保温层。但具体状况需要实地查验。这部分房屋在Wolsele社区并不罕见,当地许多房子都处于类似年代,所以本地有经验的验房师通常熟悉这类结构。关注屋顶寿命、电气系统是否升级过,会比建造年份本身更重要。
3. 864平方英尺的居住面积,实际够用吗?
这取决于你的生活方式。864平方英尺大约相当于一个两居室小型公寓的面积,对于单身或两人情侣来说足够,但如果有孩子或经常居家办公,可能会感到局促。它更适合愿意利用周边公共空间(公园、咖啡馆、图书馆)来延伸生活区域的人。注意,这个面积是“居住面积”,不包括地下室或阁楼,如果地下室有改造空间,实际可用面积会更大。
4. 土地面积全市排名靠后(前88%),是不是缺点?
在Wolsele这样的中心社区,较小地块是常态,不是缺陷。全市平均6,570平方英尺包含了大量郊区大宅,对比性不大。3,013平方英尺的地块在温尼伯老城区算标准尺寸,后院可以容纳小花园或露台,但不会有开阔草坪。如果你看重低维护成本或步出便利性,这个大小反而是优势。
5. 这个排名数据怎么理解?比如“前26%”是好事还是坏事?
每个指标排名方向不同。评估总价排名“前26%”说明在同街道上,这栋房子的估值高于74%的邻居,对于卖家来说是好事,意味着房子被市场认可的价值更高;但如果你是买家,可能意味着你要为同街上相对较小的房子付出溢价。居住面积排名“前72%”则说明在同一街道上,72%的房子面积更大,所以这栋偏小。简单说:排名靠前代表在该维度上有优势,但优势是否对你有价值,取决于你的判断。
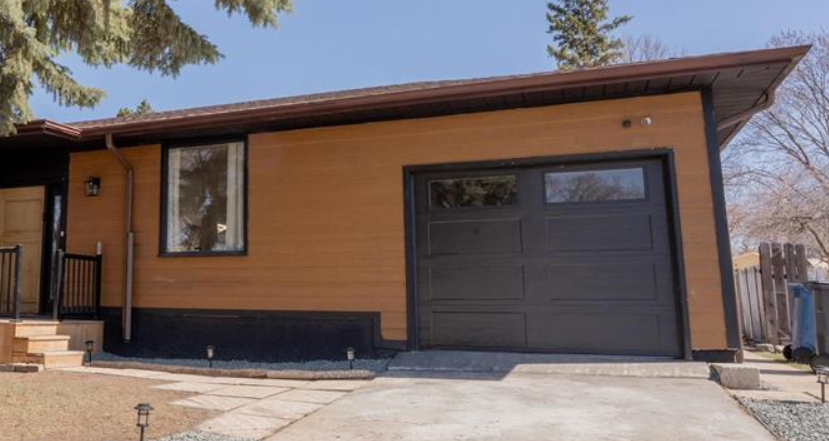
Map & Street View
Radar charts, rankings, and side-by-side layouts work best on a larger screen. Open this page on a desktop browser for the full experience.