106-18 Consulate Road

Built 1979Living Area 712 sqft
Sale History
SOLDin Dec 2024
140K±5,000
Tax Assessment
162k(prev. 153k)
+9k(+5.9%)
DateSold PriceNeighbourhood
2024-12Sold140K±5,00021/21

Rankings reflect the property's sold price position within its street, neighbourhood, and all of Winnipeg in the year of sale.

Map
Below average712 sqft · top 99% in area · built 1979 · 13 yrs older than avg
$
High-income areaMedian household income ~$100K · top tier income demographics
5-min walk to transit3 nearby routes · score 80/100
Score

Property score

Overall score
52.8Fair
How is the score calculated? ▼
Scores are weighted aggregates of property attributes (size, age, lot, sales activity) and community signals from the 2021 Statistics Canada census (income, education, housing stress, employment). 100 = top of metric within Winnipeg.
Property Score
36.8
Low
Living area
22
Year built
67
Sales activity
48
Community Score
76.8
Good
Income
85
Education
54
Housing
83
Core need
100
Employment
52
Rankings

How it stacks up

Each metric compared against 24 homes on Consulate Road, 247 in Templeton-Sinclair, and 26,841 citywide. Polygon points further from the centre = better rank.
Living Area
712 sqft
BELOW AVERAGE
StreetBottom 12%AreaBottom 1%CityBottom 15%
Same street
Bottom 12%
#21 / 24
Bottom 1%
#244 / 247
Citywide
Winnipeg
Bottom 15%
#22,921 / 26,841
Tax-Assessed Value
162 k
BELOW AVERAGE
StreetBottom 4%AreaBottom 1%CityBottom 15%
Same street
Bottom 4%
#23 / 24
Bottom 1%
#244 / 247
Citywide
Winnipeg
Bottom 15%
#22,878 / 26,841
Year Built
1979
BELOW AVERAGE
StreetTop 4%AreaBottom 9%CityBottom 37%
Same street
Top 4%
#1 / 24
Bottom 9%
#224 / 247
Citywide
Winnipeg
Bottom 37%
#16,875 / 26,841
How rankings work — each polygon vertex is the property's percentile rank within that scope. Further from the centre = better.
Detailed ranking analysis ▼
106-18 Consulate Road: Living Area Analysis

Street Level (Consulate Road): Below Average. Ranked #21 out of 24 (Bottom 12%). The street average for comparable homes is 842 sqft.

Neighborhood Level (Templeton-Sinclair): Below Average. Ranked #244 out of 247 (Bottom 1%). The neighborhood average for comparable homes is 1,052 sqft.

Citywide Level (Winnipeg): Below Average. Ranked #22,921 out of 26,841 (Bottom 15%). The citywide average for comparable homes is 1,042 sqft.

106-18 Consulate Road: Tax-Assessed Value Analysis

Street Level (Consulate Road): Below Average. Ranked #23 out of 24 (Bottom 4%). The street average for comparable homes is 203.0k.

Neighborhood Level (Templeton-Sinclair): Below Average. Ranked #244 out of 247 (Bottom 1%). The neighborhood average for comparable homes is 254.0k.

Citywide Level (Winnipeg): Below Average. Ranked #22,878 out of 26,841 (Bottom 15%). The citywide average for comparable homes is 276.9k.

106-18 Consulate Road: Year Built Analysis

Street Level (Consulate Road): Above Average. Ranked #1 out of 24 (Top 4%). The street average for comparable homes is 1979.

Neighborhood Level (Templeton-Sinclair): Below Average. Ranked #224 out of 247 (Bottom 9%). The neighborhood average for comparable homes is 1992.

Citywide Level (Winnipeg): Below Average. Ranked #16,875 out of 26,841 (Bottom 37%). The citywide average for comparable homes is 1990.

Market

Templeton-Sinclair market pulse

Past 14 years sales snapshot (~80% of all data)
Sold count
140
last 14 years
Median price
271k
14-year area median
Price per sqft
$252/sqft
area average
Avg build year
1992
area average
Market conditions · Winnipeg
Sales-to-New-Listings?
Seller's market
67.9%
Buyer'sBalancedSeller's
Sold
1,822
New listings
2,684
Sold above asking?
Last 7 days
Majority over ask
56%
Below ask56% above
79 of 141 sold above asking
What this means
Upward pressure
Demand is clearly outpacing supply. Buyers are competing, which is putting upward pressure on prices.
2026-05

How to read: Share of sales in each ~$50k price band for “templeton-sinclair” (Condos, 2024). The tallest band is the mainstream budget range; multi-year view shows how that band shifts over time.

Unlock exact sold price & PDF analysis
  • Exact sold prices
  • Detailed market analysis
  • PDF report download
  • Neighbourhood insights
  • Recent sold count in the area
Free · No credit card required
Weekly report
Winnipeg Market Report — Jun 8–14, 2026
Winnipeg's market remained active this week, with 56% of homes selling over asking and a stable $455,000 median sold price. But the premium was thinner than the previous sample: the median over-ask result was +$11,000, not a runaway bidding market across the board. For sellers, the message is still timing and pricing. The first 10 days remain the strongest window for competition. After that, the probability of a discount rises quickly. For buyers, the best opportunities are not necessarily in the cheapest homes, but in listings that have missed the early bidding window. Once a home sits beyond two weeks, negotiation room becomes much more visible.
Realtor recommended · 1 / 2
4 Bedrooms, Steps from U of M An Ideal Home for Living or Renting
In-depth Fort Richmond home review near University of Manitoba. 4-bed detached, 1,921 sqft, public sales records in 2016
Read review →
Monthly report
Highest May Detached Average on Record $477,313
Winnipeg Real Estate Market Data · May 2026 : Average sets a record May, recovery signals converge — 2026's first month with sales above the 5-year average. Detached $477,313 (highest May on record) · Condo $294,703 (just shy of the 2025 record) Three "2026 firsts": sales above 5-yr avg · listings above last year · Condo sales above last year
Nearby rentals?
Apartments within 2 km
2 km
24
Buildings
18
Available
$995 - $2,092
Rent range

A quick signal for rental-market activity, potential tenant demand, and rental competition around this home.

View Winnipeg rental map →
Community deep dive

Who lives in this neighbourhood

Dissemination area #46110006 · Statistics Canada 2021 Census · Population 518
518
Population (2021)
47.2
Median age
2.8
Avg household size
3,700 / km²
Population density
Distribution by household income band
0-5k
3%
20k-25k
3%
30k-35k
3%
40k-45k
3%
45k-50k
3%
50k-60k
6%
60k-70k
9%
70k-80k
6%
80k-90k
6%
90k-100k
9%
100k-125k
17%
125k-150k
9%
150k-200k
11%
200k plus
14%
$100K
Median household income
$107K
Average household income
5%
Low income (LIM-AT)
0.2
Income inequality (Gini)
2.8
P90 / P10 ratio
24%
Single-person households
27%
Families with children
61%
Labour participation
16%
Unemployment
Local · Day-to-day

Transit, amenities & safety

Everything within walking distance, plus crime and waste collection.

Nearby Amenities

Dining, education, healthcare, shopping & more

106-18 Consulate Road — 7 amenities found within 500 m, across 1 categories, including 7 parks (nearest 112 m).

Search radius
🌳Parks7

Crime & safety

Templeton-Sinclair · WPS public data
Full crime data →
Annual incidents
53
2026
vs. city average
+80%
▲ relative to avg
Year-over-year
▼ -92%
vs. prior year
Primary type
Property
85% of incidents

We are licensed Manitoba real estate agents. Contact us to obtain all MLS whole sold records for 106-18 Consulate Road. No advertising. Data source details →

Related homes

Highlights & common questions

Is this home right for you?

Property highlights

Overall 52.8

Smaller and older than most nearby homes

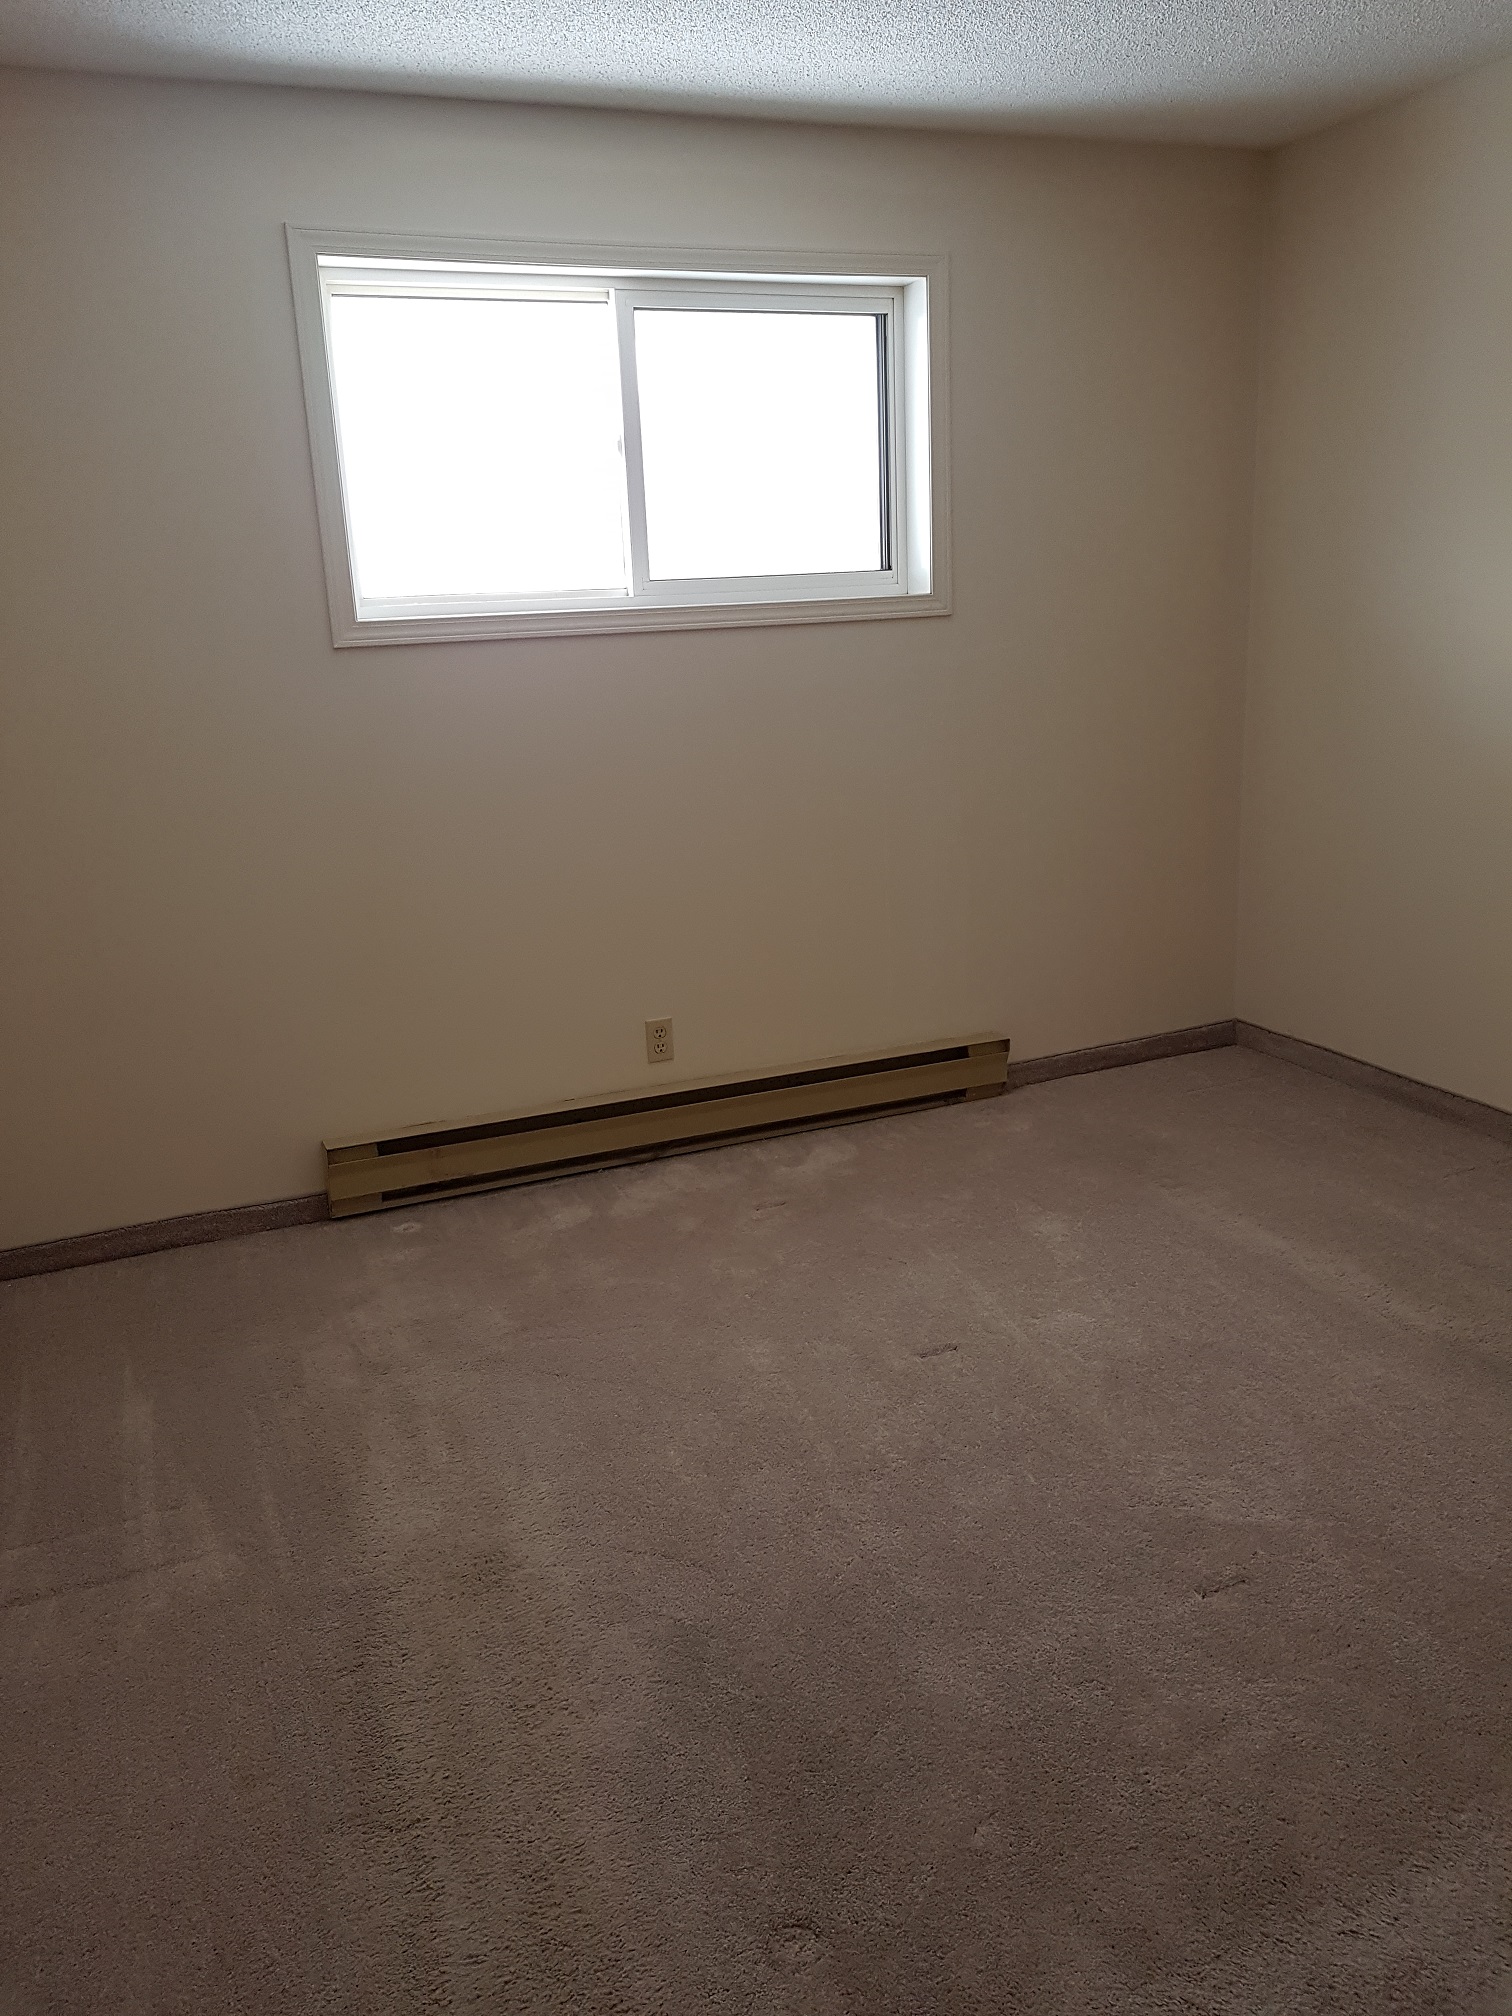
712 sqft (bottom 1%)

Built in 1979 (13 yrs older than avg)

Located in a high-income area

with median household income of ~100k

Transit 80.0

5-min walk to transit with 3 nearby routes

Within 500m: 7 parks nearby