Property score
How it stacks up
Detailed ranking analysis ▼
Street Level (Dalhousie Drive): Around Average. Ranked #28 out of 62 (Top 45%). The street average for comparable homes is 897 sqft.
Neighborhood Level (Fort Richmond): Below Average. Ranked #385 out of 653 (Bottom 41%). The neighborhood average for comparable homes is 894 sqft.
Citywide Level (Winnipeg): Below Average. Ranked #17,973 out of 26,841 (Bottom 33%). The citywide average for comparable homes is 1,042 sqft.
Street Level (Dalhousie Drive): Below Average. Ranked #48 out of 62 (Bottom 23%). The street average for comparable homes is 212.0k.
Neighborhood Level (Fort Richmond): Around Average. Ranked #268 out of 653 (Top 41%). The neighborhood average for comparable homes is 185.3k.
Citywide Level (Winnipeg): Below Average. Ranked #19,819 out of 26,841 (Bottom 26%). The citywide average for comparable homes is 276.9k.
Street Level (Dalhousie Drive): Around Average. Ranked #22 out of 62 (Top 35%). The street average for comparable homes is 1991.
Neighborhood Level (Fort Richmond): Above Average. Ranked #74 out of 653 (Top 11%). The neighborhood average for comparable homes is 1980.
Citywide Level (Winnipeg): Below Average. Ranked #14,556 out of 26,841 (Bottom 46%). The citywide average for comparable homes is 1990.
Fort Richmond market pulse
How to read: Share of sales in each ~$50k price band for “fort richmond” (Condos, 2024). The tallest band is the mainstream budget range; multi-year view shows how that band shifts over time.
- Exact sold prices
- Detailed market analysis
- PDF report download
- Neighbourhood insights
- Recent sold count in the area
A quick signal for rental-market activity, potential tenant demand, and rental competition around this home.
View Winnipeg rental map →Who lives in this neighbourhood
Transit, amenities & safety
Nearby Amenities
1305-40 Dalhousie Drive — 27 amenities found within 500 m, across 6 categories, including 13 dining (nearest 226 m), 3 education (nearest 221 m), 5 healthcare (nearest 129 m).
Crime & safety
We are licensed Manitoba real estate agents. Contact us to obtain all MLS whole sold records for 1305-40 Dalhousie Drive. No advertising. Data source details →
Related homes
Nearby interested homes
Address · Year Built · Living Area
Nearby properties
Address · Distance
Similar assessed value
Address · Tax-Assessed Value
Is this home right for you?
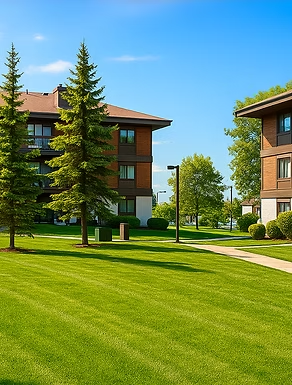
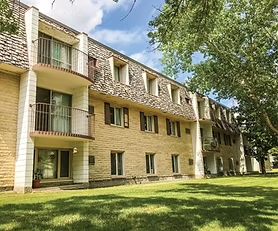
Property Overview: 1305-40 Dalhousie Drive, Fort Richmond, Winnipeg
Section 1: Key Characteristics & Appeal
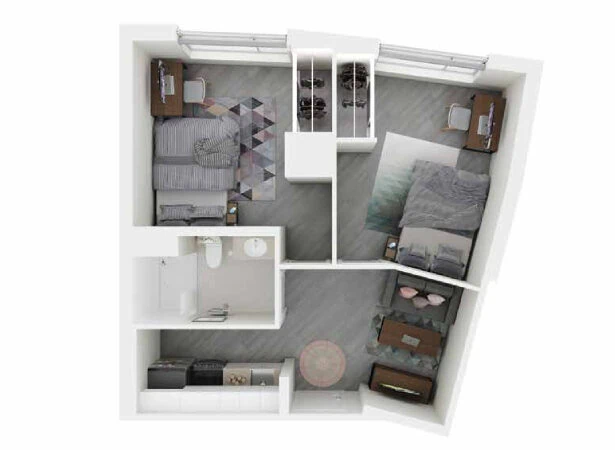
This 875 sqft condominium, built in 1986, presents a practical and straightforward housing option in Winnipeg's Fort Richmond neighborhood. Its appeal lies in its unassuming, average metrics across several categories, which translates to a stable and predictable value proposition within its immediate area. Compared to other units on Dalhousie Drive and in Fort Richmond, its living space, assessed value ($160k), and age are all consistently around the local average. This suggests a unit that is neither exceptional nor deficient, but rather a typical representation of the building and community.
The property would suit first-time buyers or investors seeking an entry point into the market with lower financial exposure, as its assessed value sits notably below the Winnipeg city-wide average for comparable homes. It also appeals to those who prioritize location and functionality over luxury, or anyone looking for a low-maintenance lifestyle without the surprises of a highly unique or outlier property. A less obvious perspective is that a home with such "middle-of-the-pack" characteristics can offer a sense of insulation from market volatility, as it doesn't carry the premium of top-tier features nor the steep discounts of problem properties.
Section 2: Frequently Asked Questions
1. Is this a good value for the money?
Based on the data, its assessed value is competitive within the Fort Richmond area (ranking near the middle) but is positioned below the city-wide average, which could indicate a relative value opportunity for a buyer focused on this specific neighborhood.
2. What does the sold price history tell me?
The last recorded sale was between $135k-$165k in August 2021. This range, significantly higher than the current assessed value, suggests the assessment may not fully reflect recent market prices, and a current market evaluation would be essential.
3. How does its size and age compare?
At 875 sqft, it's very close to the average size for similar units in the building and neighborhood. Built in 1986, it is newer than many Fort Richmond comparables but is an average-age building for the city overall, implying common features and potential maintenance points for its era.
4. Who manages the condominium corporation, and what are the fees?
This information is not provided in the public data. A critical next step is to review the condo corporation's financial health, bylaws, and monthly fee structure, which greatly impact affordability and living experience.
5. Why is the city-wide assessed value ranking so high (Top 81%)?
A high percentile rank for assessed value means the value is low compared to peers. This indicates that, city-wide, many comparable homes are assessed at a higher value. This doesn't necessarily mean it's a bargain, but it highlights that values in this specific building or complex are positioned at a more accessible tier within the broader Winnipeg market.